760
Proceedings of the 18
th
International Conference on Soil Mechanics and Geotechnical Engineering, Paris 2013
equilibrium, the
SRF
is gradually increased. This means that the
soil shear strength becomes weaker, until it is no longer possible
for the FE model analysis to reach convergence. At this stage, it
can be said that failure of the slope occurs and the FOS equals
the
SRF
. Non-convergence within a specified number of
iterations and tolerance is an indicator of slope failure because
of the absence of force equilibrium (i.e. stress and displacement
distributions that satisfy the equations of equilibrium cannot be
established based on the factored set of shear strength
parameters).
The FEM-SSR analysis has been shown to be a powerful and
a useful alternative to conventional LEM slope stability analysis
technique, Griffiths
et al
(1999, 2007), Wei, etc. (2009).
SoilVision Systems Ltd. has incorporated the 3D FEM-SSR into
its commercial package - SVSOLID 3D. Consequently, the 3D
FEM-SSR is now readily available to geotechnical engineering
practice.
2 EXAMPLES
2.1 Example 1 - 3D slope with external load
Wei, Cheng and Li (2009) considered a slope with a
rectangle area of vertical external loading in order to show a
distinct 3D failure surface. As shown in Figure 1, the vertical
distribution loading length is 8m and width is 2m, while in Wei,
etc. (2009) many different combinations of length and width
were considered. The edge of the loading is 1m away from the
crest of the slope. The magnitude of the distribution load
q
is
equal to 100 kPa. The soil shear strength properties are cohesion
of 20 kPa, an angle of internal friction of 20 degrees and a unit
weight of 20 kPa. Table 1 shows the results of the various
analyses. Figure 2 and Figure 3 clearly show the distinct 3D
failure surface based on a FEM-SSR analysis. Figure 4 shows
the critical slip surface based on a 3D LEM analysis. It can be
seen that both the failure slip surface shape and FOS values
from the FEM-SSR result and the 3D LEM result match well
with the Wei et al. (2009) result.
Table 1. Comparison of 3D FOS for the slope in Example 1
SVSLOPE3D
(LEM)
SVSOLID3D
(SSR)
Wei, etc( 2009)
(SSR)
1.359
1.402
1.42
Figure 1. The geometry of the slope with external load in SVSLOPE 3D
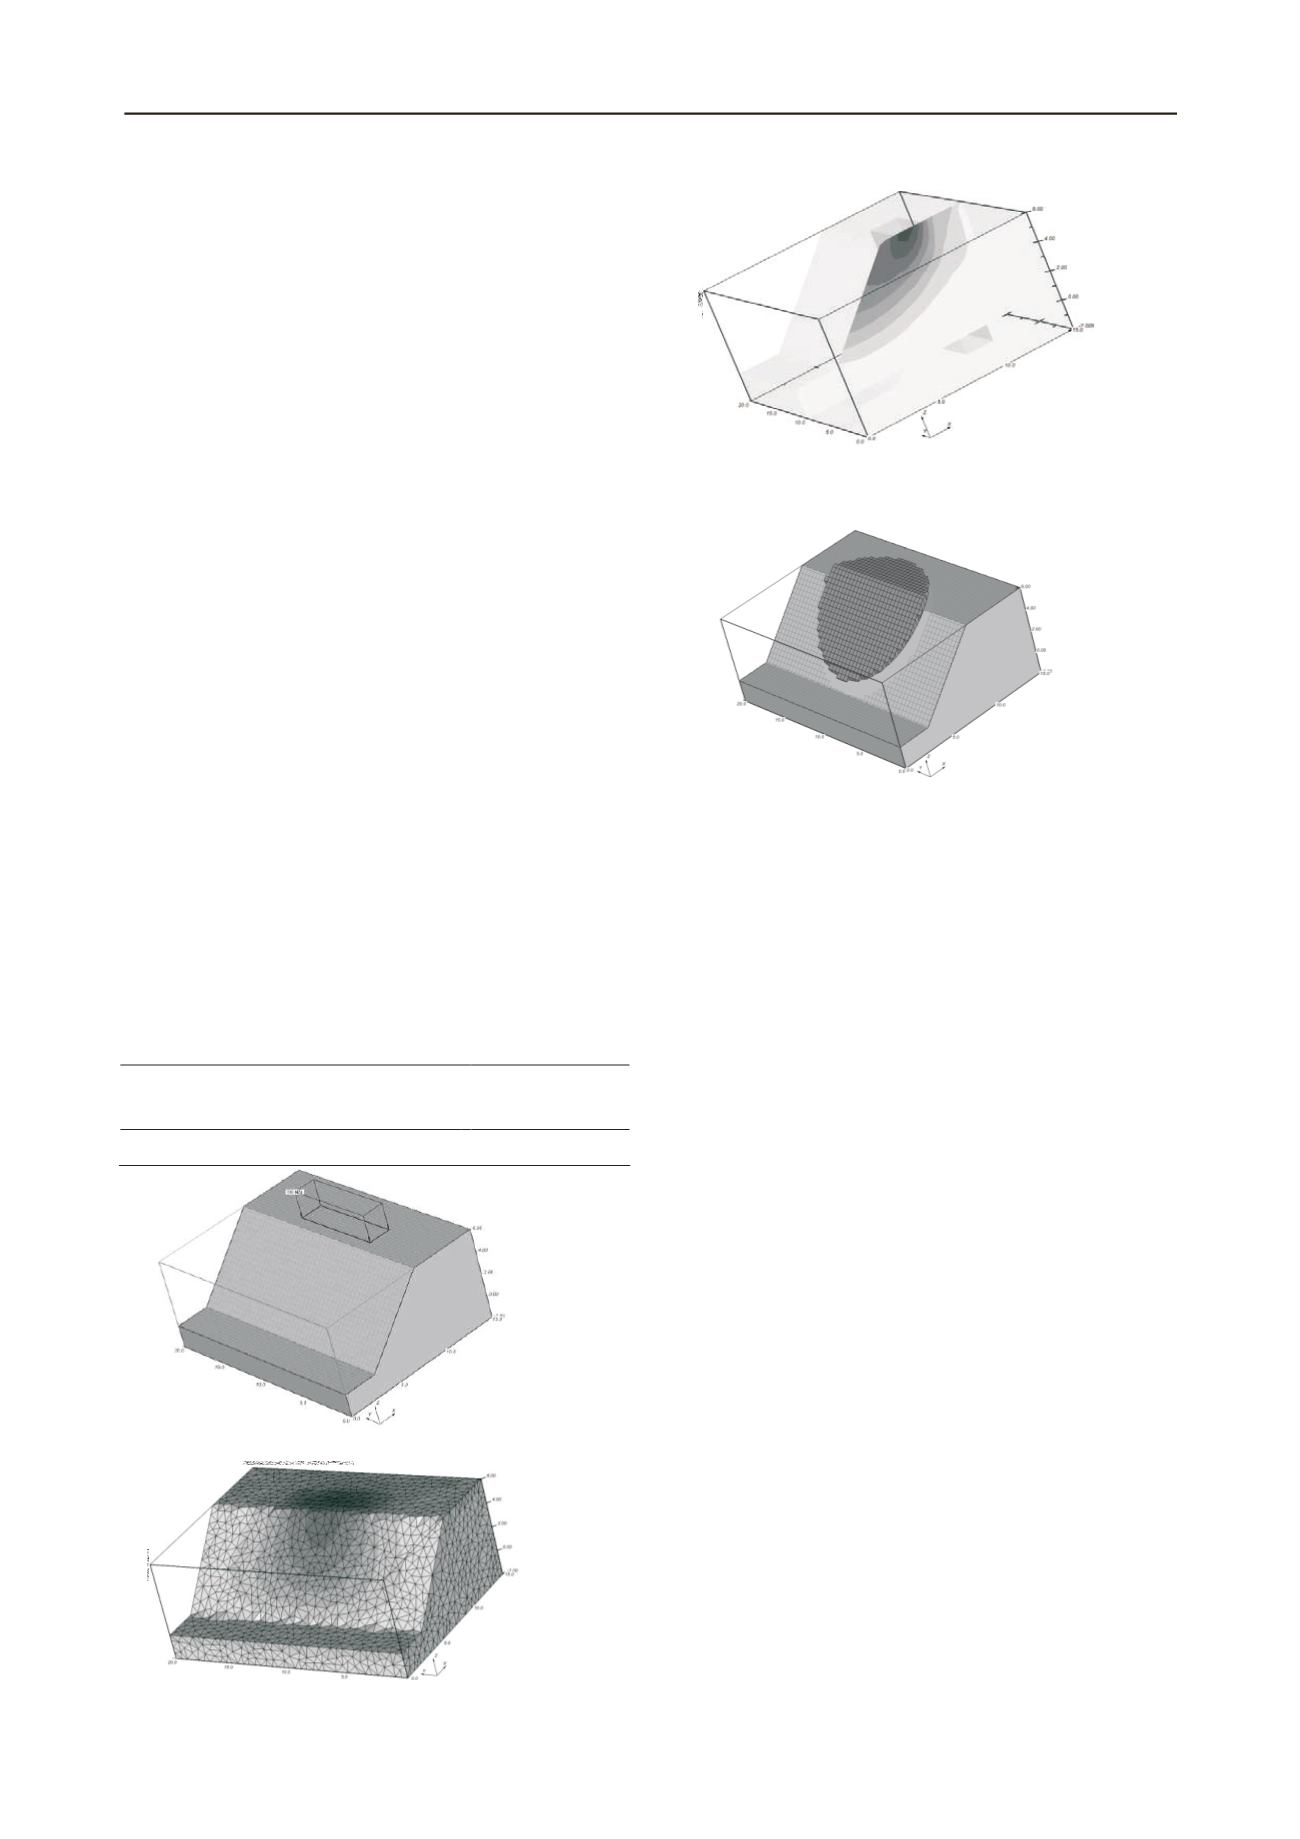
Figure 2. Contour of total displacement of 3D FEM-SSR analysis for
example 1 at the final stage.
Figure 3. Y-section view of the contour of the total
displacement for example 1
Figure 4. Critical slip mass of the 3D LEM analysis with
explosive view for example 1
2.2 Example 2 - A nonsymmetrical slope with corners
One of the advantages of the 3D FEM-SSR analysis is that
the sliding direction does not need to be specified in advance. A
limitation for 3D column-based LEMs is that the sliding
direction of the critical slip surface is another variable which
must be determined through a searching procedure. A new
feature has been added in SVSLOPE 3D to search for the
critical slip surface direction with optimization. There is
continued usefulness in the LEM because of its computational
efficiency. Computational times for FEM-SSR methods are
significantly higher than for LEM analysis. This efficiency is
particularly useful in performing a 3D analysis when the
number of computations is significantly increased. The purpose
of this example is to test the efficiency of both 3D FEM-SSR
slope stability analysis and 3D LEM slope stability analysis for
general slopes without evident sliding direction information
available.
In this example, a general asymmetrical slope with inclined
corners is considered. As shown in Figure 5 and Figure 6, there
are three slopes with different inclinations, the right slope's
inclination is 1:2, the left slope's inclination is 1:1.5 and the
middle slope's inclination is 1:1.3 respectively. This model is
digitized from Jiang (1997). The soil's Mohr-Coulomb shear
strength parameters are a cohesion of 5 kPa and an angle of
internal friction of 12 degrees.
Table 2 shows the comparison from different analysis
results. Jiang (1997) shows a FOS = 0.96 based on 3D
Simplified Janbu method with DP searching. The FOS from
FEM-SSR analysis is 0.941. The contour of the final
displacement at the final stage is shown in Figure 7. The critical
slip mass based on 3D LEM analysis is shown in Figure 6. The
FOS is 0.957 and 0.977 separately for Simplified Bishop and
Spencer method. The critical slip direction also needs to be
found. As shown in Figure 8, the critical slip surface direction is
43 degree counter-clock wise from the negative x direction. It
can be seen clearly that both the shape and slip direction are
2
reduction factor. In order to reach to the state of limiting
equilibrium, the
SRF
is gradually increased. This means that the
soil shear strength becomes weaker, until it is no longer possible
for the FE model analysis to reach convergence. At this stage, it
can be said that failure of the slope occurs and the FOS equals
the
SRF
. Non-convergence within a specified number of
iterations and tolerance is an indicator of slope failure because
of the absence of force equilibrium (i.e. stress and displacement
distributions that satisfy the equations of equilibrium cannot be
established based on the factored set of shear strength
parameters).
The FEM-SSR analysis has been shown to be a powerful and
a useful alternative to conventional LEM slope stability analysis
technique, Griffiths
et al
(1999, 2007), Wei, etc. (2009).
SoilVision Systems Ltd. has incorporated the 3D FEM-SSR into
its commercial package - SVSOLID 3D. Consequently, the 3D
FEM-SSR is now readily available to geotechnical e gineering
practice.
2
EXAMPLES
2.1
Example 1 - 3D slope with external load
Wei, Cheng and Li (2009) considered a slope with a
rectangle area of vertical external loading in order to show a
distinct 3D failure surface. As shown in Figure 1, the vertical
distribution loading length is 8m and width is 2m, while in Wei,
etc. (2009) many different combinations of length and width
were considered. The edge of the loading is 1m away from the
crest of the slope. The magnitude of the distribution load
q
is
equal to 100 kPa. The soil shear stre gth properties are cohesion
of 20 kPa, an angle of internal friction of 20 degrees and a unit
weight of 20 kPa. Table 1 shows the results of the various
analyses. Figure 2 and Figure 3 clearly show the distinct 3D
failure surface based on a FEM-SSR analysis. Figure 4 shows
the critical slip surface based on a 3D LEM analysis. It can be
seen that both the failure slip surface shape and FOS values
from the FEM-SSR result and the 3D LEM result match well
with the Wei et al. (2009) result.
Table 1. Comparison of 3D FOS for the slope in Example 1
SVSLOPE3D
(LEM)
SVSOLID3D
(SSR)
Wei, etc( 2009)
(SSR)
1.359
1.402
1.42
Figure 1. The geometry of the slope with external load in SVSLOPE 3D
Figure 2. Contour of total displacement of 3D FEM-SSR analysis for
example 1 at the final stage.
Figure 3. Y-section view of the contour of the total displacement for
example 1
Figure 4. Critical slip mass of the 3D LEM analysis with explosive view
for example 1
2.2
Example 2 - A nonsymmetrical slope with corners
One of the advantages of the 3
l sis is that
the sl ding direction does not n ed t
ance.
l mitation for 3D column-based
sliding
direction of the cr tical slip surface i
i le hich
must be d termined through a searc i
r . ne
feature has been a ded in SVSL
t s r for the
critical slip surface direction ith opti ization. There is
continued usefulness in the LE because of its co putational
efficiency. Computational times for FE -SSR ethods are
significantly higher than for LEM analysis. This efficiency is
particularly useful in performing a 3D analysis when the
number of computations is significantly increased. The purpose
of this example is to test the efficiency of both 3D FEM-SSR
slope stability analysis and 3D LEM slope stability analysis for
Conference on Soil Mechanics and Geotechnical Engineering, Paris 2013
he soil to the
surface. This
.
ternal friction
and
are
the strength
e of limiting
eans that the
nger possible
t this stage, it
e FOS equals
number of
ilure because
displacement
um cannot be
ear strength
Figure 2. Contour of total displacement of 3D FEM-SSR analysis for
example 1 at the final stage.


