864
Proceedings of the 18
th
International Conference on Soil Mechanics and Geotechnical Engineering, Paris 2013
-1.2 -1.0 -0.8 -0.6 -0.4 -0.2 0.0 0.2
-1350
-1300
-1250
-1200
-1150
-1100
-1050
-1000
Normalized vertical stress of cement
1 day
10 days
20 days
30 days
40 days
50 days
60 days
Depth (m)
Tension
Compression
Point D
Point B
Point A
Point C
Depressurization source
Figure 6. Normalized vertical stress
σ
y
of cement
Figure 6 shows the relationship between water depth and
vertical stress of cement during methane hydrate production.
The results were plotted for each different elapsed time, and
compression is positive in the figure. In addition, it was
normalized by maximum stress to make qualitative
understanding easily. Firstly, compressive stress appeared from
seabed to -1280m and tensile stress appeared below on the first
day. The initial stress by self-weight is distributed linearly.
However, tensile stress has occurred because production well
was jerked by the settlement of depressurized area. Ten days
after, tensile stress was applied dramatically on where -1100m
to -1300m. It is considered that the high tensile stress acted on
cement through the interfaces of cement and strata because the
upper layer deform downward by methane hydrate reservoir had
consolidated. The stresses decline 50 days after in this
simulation.
It is confirmed that high tensile stress appear on cement
about 50m range above the depressurization area, and
compression stress appear on open hole which is
depressurization area. Moreover, it became clear that near Point
B where is a junction of a casing and open hole part becomes
neutral point.
6. CONCLUSIONS
A multi phase coupled simulator using finite element method
named "COTHMA" had used for predicting stresses and
deformation of methane hydrate vicinity production well and
the deep seabed ground which simulating NANKAI trough
where is planned as Japan's first offshore production test area.
According to analytical results, depressurization area was
extended rapidly in first 10 days, and the tip of depressurized
area attained 20m from production well. the elements near
production well are compressed by increased effective stress
due to depressurization. Then, a lower part of reservoir heaved
vertically by effect of consolidation centered on
depressurization source with 10 MPa pressure difference. On
the other hand, a upper part of reservoir has deformed
downward into the perpendicular. And there is a neutral section
from depressurization source horizontally which has not
deformed vertically.
The maximum principal stress vectors are distributed like
arch structure over the upper and lower layer. Moreover it have
supported upper layer. Therefore, deformation of seabed ground
near production well is greater than bottom of sea's. However,
high tensile stress appear on cement about 50m range above the
depressurization area, and compression stress appear on open
hole which is depressurization area. It was found that the
settlement of the seabed cause negative friction along
production well.
7. ACKNOWLEDGEMENTS
This research has been conducted under the auspices of the
MH21 Research Consortium on the national methane hydrate
exploitation program planned by ministry of economy, trade
and industry (METI). Thanks are due to our sponsors and
partners.
We appreciate insightful discussions and supports of Dr.
Houlang and Mr. Takiguchi.
8. REFERENCES
Desai, CS, Zaman, MM, Lightner, JG and Siriwardane, HJ. 1984.
Thinn-layer for interfaces and joints,
Int. J. of Numerical &
Analytical Methods in Geomechanics
, 8, 19-43.
Sakamoto, Y, Masayo, K, Kuniyuki, M, Norio, T, Takeshi, K and
Tsutomu, Y. 2009. Numerical Study on Dissociation of Methane
Hydrate and Gas Production Behavior in Laboratory-Scale
Experiments for Depressurization: Part 3-Numerical Study on
Estimation of Permeability in Methane Hydrate Reservoir.
Int J
Offshore and Polar Eng
, 19(2), 124-134.
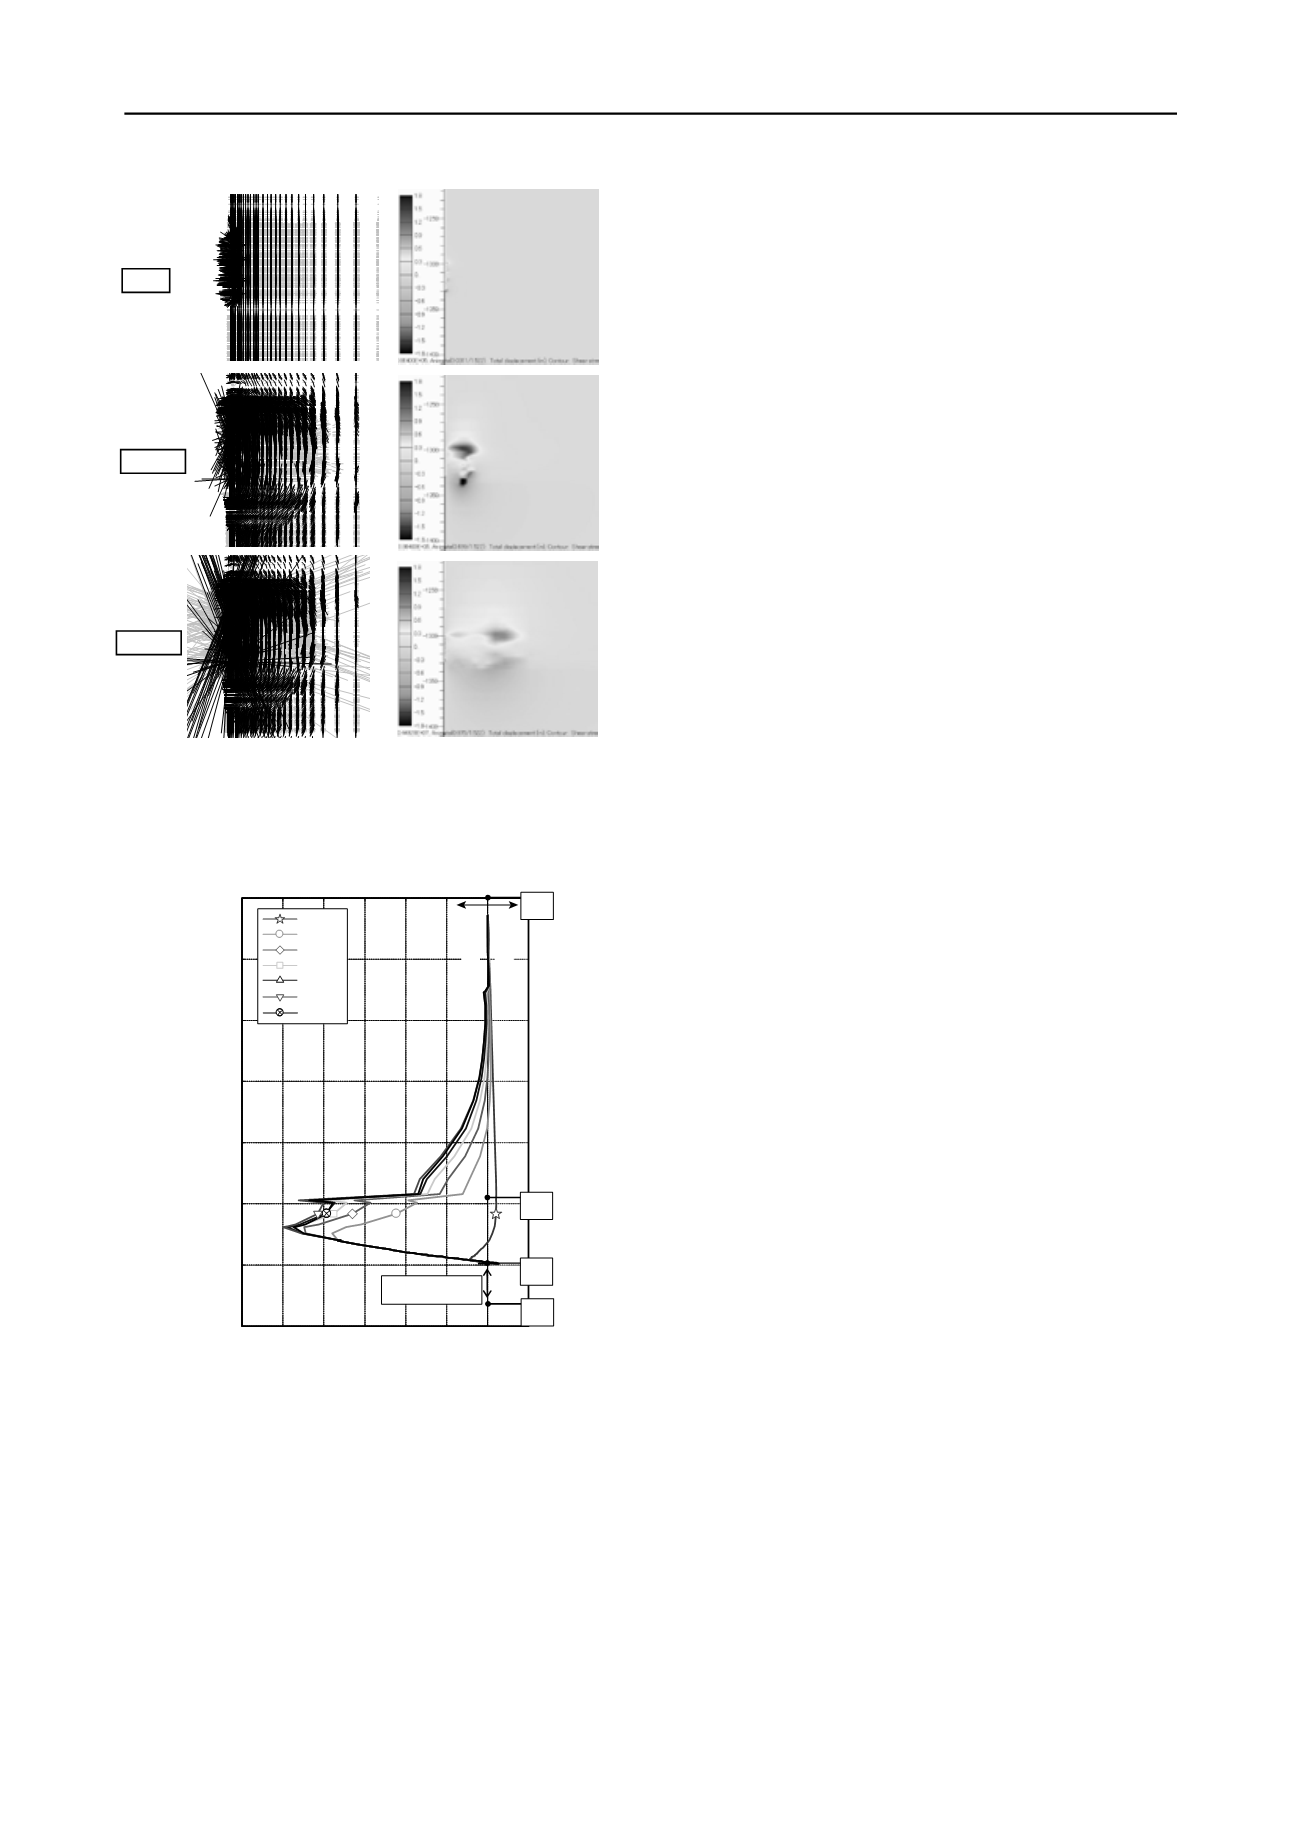
Figure 5. Stress vector and shear strain by depressurization.
(a) Principal stress of each element
near depressurization area
(Maximum stress, Black; Minimum stress, Gray)
(b) Shear stress
1 day
10 days
60 days


