862
Proceedings of the 18
th
International Conference on Soil Mechanics and Geotechnical Engineering, Paris 2013
・
Consider the influence of phase changing and energy flow
rule target on solid, liquid and gas phase.
・
The temperature of soil particle, pore water, methane gas,
methane hydrate and ice is same in local area. It is assumed
that heat conduction is performed promptly.
・
Disregard the deformation of solid phase in equation of
continuity for hydrate and law of the conservation of energy.
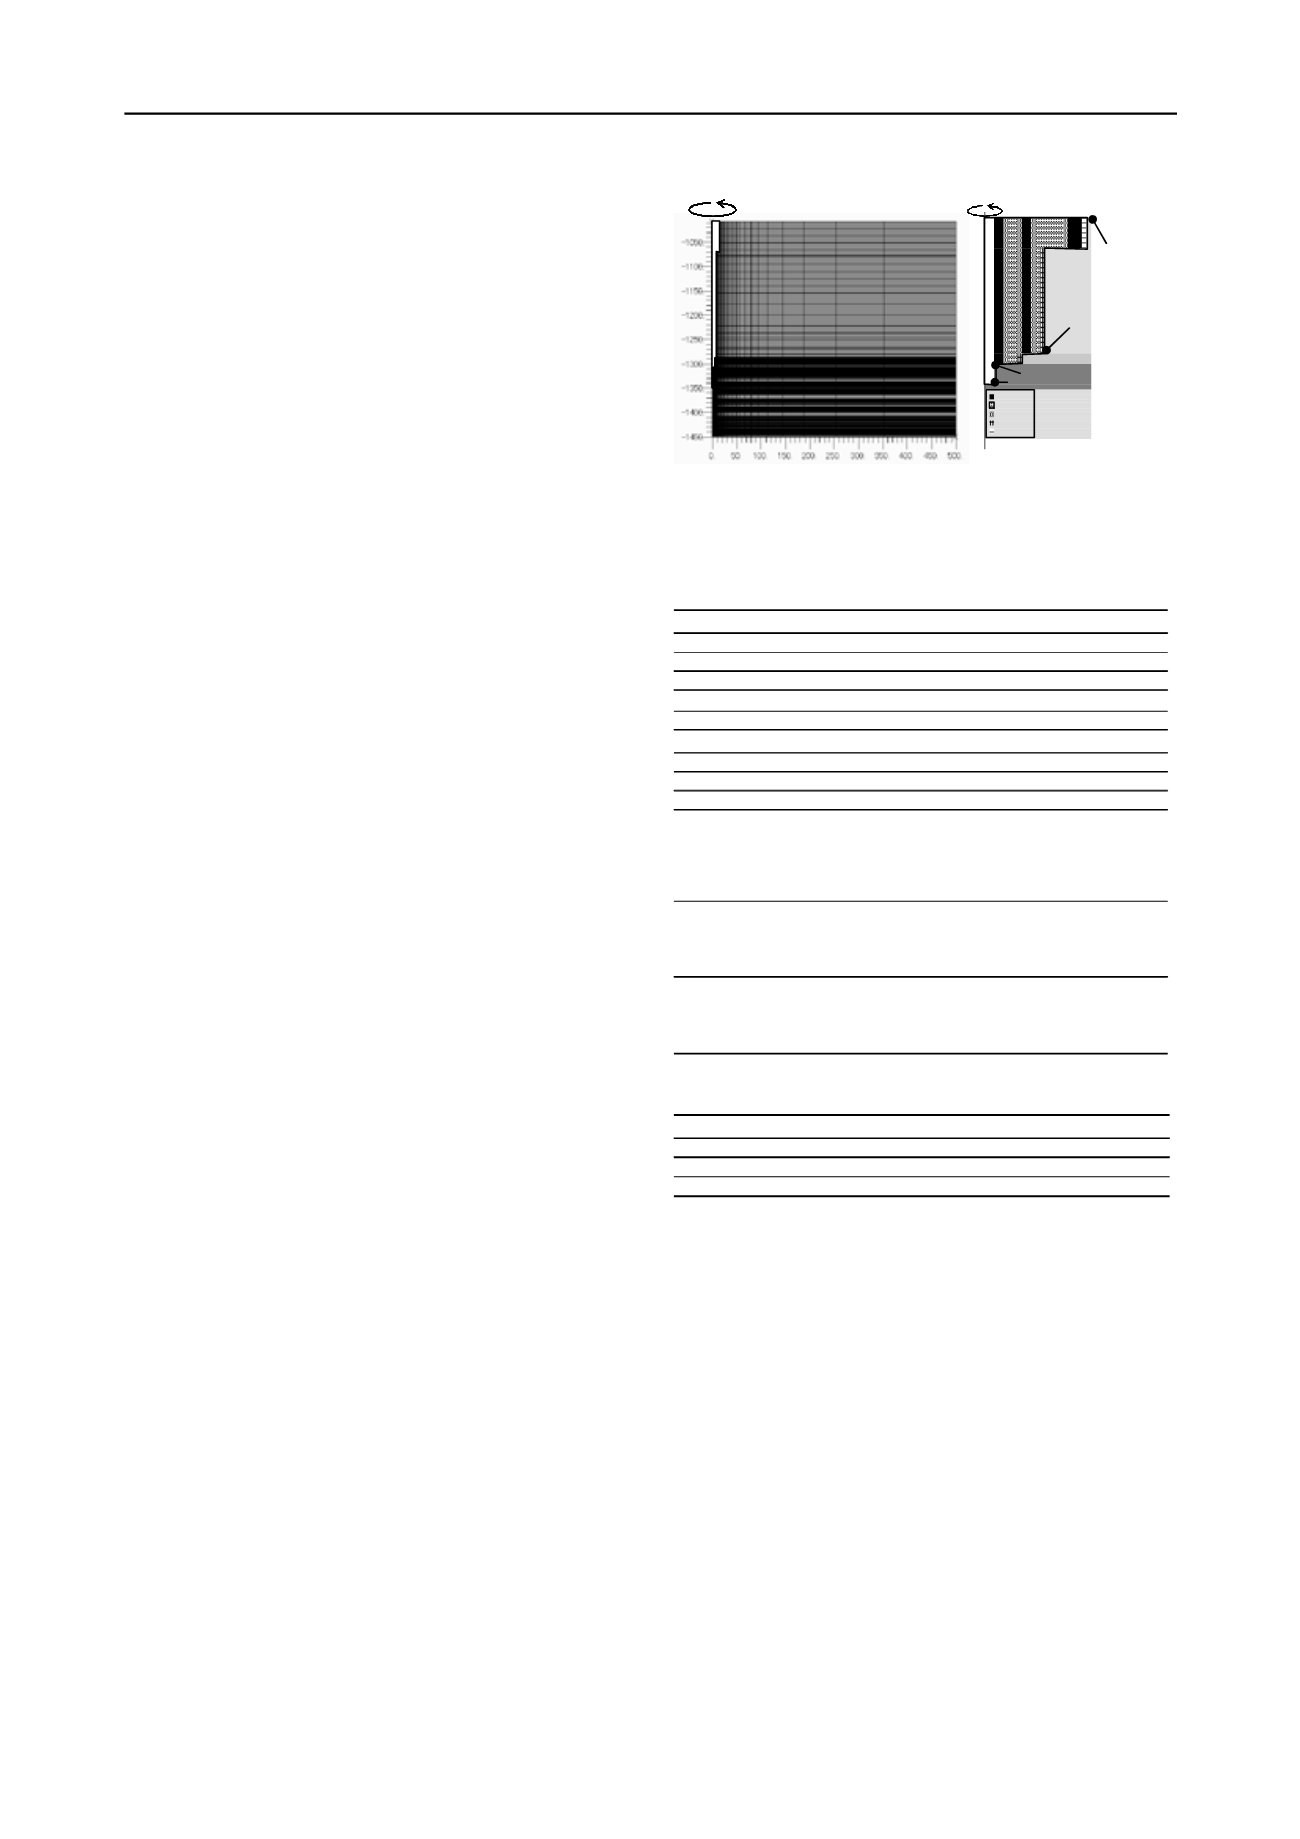
4. SIMULATION MODELS
4.1. Geological Model and Boundary Conditions
A simulation was performed assuming MH production using the
depressurization method employed in the eastern Nankai
Trough region in Japan. The analysis was performed assuming
an elasto-plastic axi-symmetry problem. Finite element mesh
for model of seabed is shown on Figure 1 (a). The model,
consists of 18054 elements and 18512 nodes, has an area of
450m depth × 1000m diameter, and is located at 1000 m water
depth. It is assumed that the layer 290m~340m from the ground
surface as the MH-bearing layer with a MH saturation level
which were investigated at the time of test boring in Nankai
Trough. The conditions for each boundary are follows. (1) Top
of the model are permeable for pore water and gas, and
temperature fixed. (2) Periphery (Right side) of the model is
permeable for water and gas, and temperature fixed. (3) Bottom
of the model is permeable for water and gas, and temperature
fixed. (4) Borehole (left side) is impermeable for water and gas
exclude the depressurization area, and zero heat flux. The
production well has three parts which are casing made with steel,
cement and soil. Then, it has three set of interfaces that is shown
in figure 3 (b). First interface (joint 1) is between casing and
cement. Interface between cement and soil is second (joint 2).
Third interface (joint 3) is between casing and soil. These
interface are modeled by using joint element which proposed by
Desai (1984). Methane hydrate reservoir was depressurized over
24 hours from depressurization area where the pore pressure
decreases from hydrostatic pressure to 3 MPa at bottom of the
borehole. This area was made to open hole. Methane gas is
produced by maintaining the pressure at the area of
depressurization for the next 60 days.
4.2. Material Parameter
Simulation was performed having assumed seabed ground to be
liner elastic and perfect plastic material. The material
parameters were shown in Table 1 & Table 2. Parameters which
have no core were determined from the research in the past.
5. SIMULATION RESULTS
Figure 3(a) shows the effect of production on the distribution of
water pressure. The figure expands and shows the nearby area
from depressurization source. It is seen that the reduction in the
pressure is centered at the area of depressurization.
Depressurization area was extended rapidly in first 10 days, and
the tip of depressurized area attained 20m from production well.
The depressurized area expand in horizontally more next 10
days. The strata about 50m in radius was depressurized from the
production well after 60 day. The layer for which
depressurization was conspicuous is observed under methane
hydrate reservoir. This layer has high permeability for
horizontally, because the hydrate saturation compared low with
upper reservoir. The hundreds of sand and mud layer have
overlapped in hydrate reservoir which has various permeability,
Table 1. Material parameters.
unit
MH-bearing layer Mud layer
MPa
E=700
・
S
h
+100
80
-
0.4
0.4
mD
-
-
K
-
5.8×10
-4
5.8×10
-4
-
5.3
5.3
-
0.1
0.1
-
0.1
0.1
soil
kg/m
3
water
kg/m
3
gas
kg/m
3
MH kg/m
3
soil
J/(kg
・
K)
water J/(kg
・
K)
gas J/(kg
・
K)
MH J/(kg
・
K)
soil J/(m
・
s
・
K)
1.7
2.915
water J/(m
・
s
・
K)
gas J/(m
・
s
・
K)
MH J/(m
・
s
・
K)
0.586
0.03
Thermal conductivity
0.45
0
913
1050
4190
2100
2010
Measured value of core
Measured value of core
Measured value of core
Measured value of core
2650
1000
Temperature
α
(Van Genuchten)
n (Van Genuchten)
Immovement water saturation
Residual gas content
Index
Density
Soil specific heat
Elastic modulus
Poisson's ratio
Permiability
Porosity
MH saturation S
h
Table 2. Interface strength
Index
Unit
Joint 1
Joint 2
Joint 3
Friction angle
o
45
20
20
Cohesion
MPa
2
0
0
Shear modulus
MPa
28
28
28
Elastic modulus
MPa
80
80
80
however, it turns out that it depressurize in general uniformly.
The results are because of high pressure difference about 10
MPa. Figure 3(b) shows the distribution of MH saturation ratios
with the decomposition of MH. The region spreads by about
20m wide from the production well at 10 day past. The area of
methane hydrate dissociated was spread gradually followed by
depressurization which was shown in Figure 3(a). It is observed
that the area spread horizontally 30m in 20 days, and 50m in 60
days. Dissociation of methane hydrate has not stopped yet after
the 60 days in depressurized area. In addition, methane hydrate
which exists 20m in radius from production well has not
product completely, because it has self-preservation effect.
Figure 3(c) shows the distribution of methane gas content.
Signs that methane is generated could be confirmed as methane
hydrate dissociate. The elements with a high gas content being
restricted to the range of 10m from the production well, though
the gas generated area was still spreading. Generated gases
moved at high speed with water which generated by
dissociation of methane hydrate too. It seems that the high gas
content elements generated because the gases from the
surroundings
gathers for near production well. Figure 3(d)
shows the distribution of vertical displacement. It was
Figure 1. Finite element analytical model
(18054 elements, 18512 nodes)
Sea bottom
(a) Geological modeling
(b)Modeling for
production well
Casing
Cement
Joint1
Joint2
Joint3
Point D
Point C
Point B
Point A


