863
Technical Committee 103 /
Comité technique 103
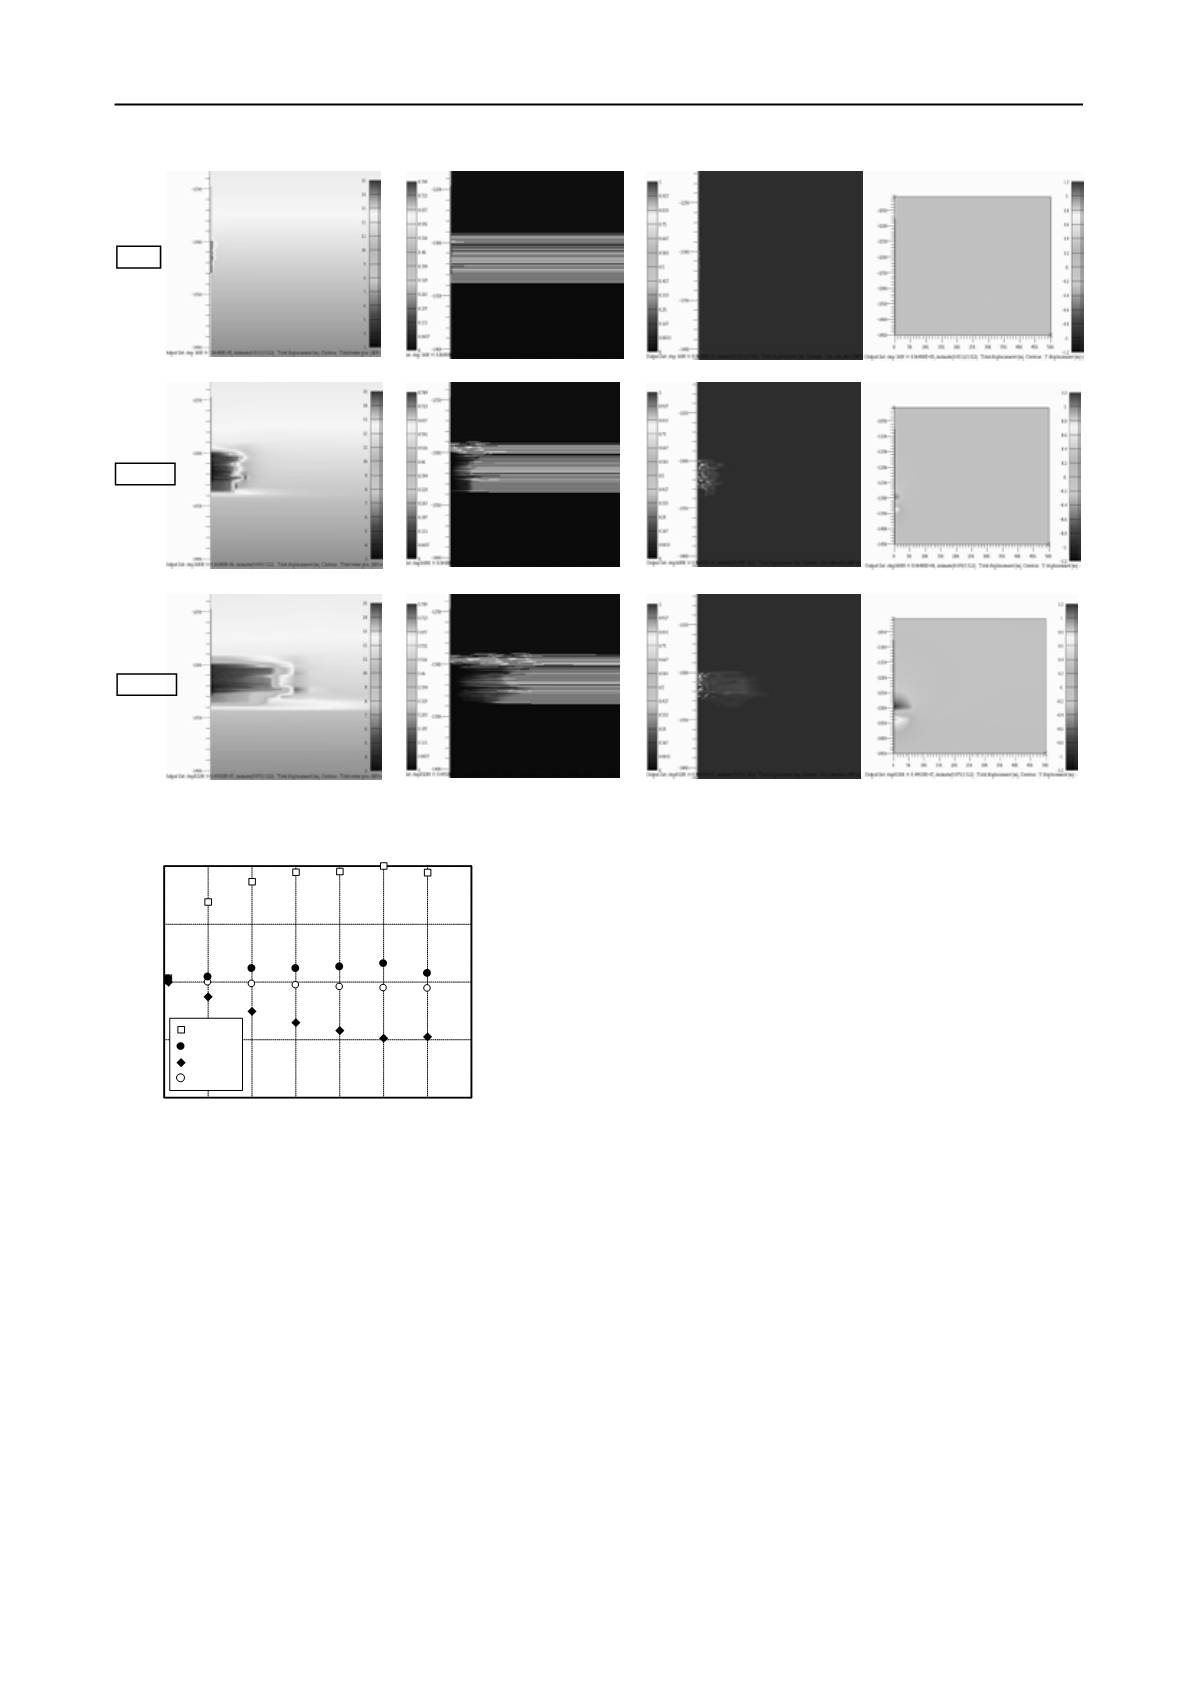
Figure 4. Normalized vertical displacement of each point.
observed that there is a neutral
section from depressurization
source horizontally which has not deformed vertically from the
figure. A lower part of reservoir heaved vertically by effect of
consolidation centered on depressurization source with 10 MPa
pressure difference. On the other hand, a upper part of reservoir
has deformed downward into the perpendicular. The
deformation near production well appeared greatly rather than
settlement of sea bottom in the result of 60 days. The area of
deformation is almost same as the area of a depressurization.
And furthermore, it is clear that there is a few influence of the
motion on the whole stratum in case of short production.
Relationship between vertical displacement of each point of
strata and elapsed time is shown in figure 4. Each point A to D
were shown in Figure 1 (b), and these points are located near
production well. Here, the figure shows normalized results by
maximum displacement for understanding qualitatively. Point A
shows maximum displacement where located at borehole
bottom. This point has heaved upward into the perpendicular
because the consolidations of methane hydrate reservoir and
lower layer. Point B has also shown some heaving, while Point
C has subsided. Therefore, it is expected that the neutral point
exists between Point B and C. And Point A which is sea bottom
hardly deformed. Any deformation is heading for convergence
in about 50 days. However, it is necessary to examine long term
analysis for understanding whole movement of seabed ground
during methane hydrate production.
Maximum and minimum principal stress vector of each
element were shown in figure 5(a). Maximum principal stress
illustrated in blue vector and minimum principal stress
illustrated in red vector in this figure. High horizontal stress
appeared in neighborhood of depressurization source in first day.
High stress generated by effective stress increase with reducing
pore water pressure, and the stratum was horizontally
compressed to the production well. Then, the vector diagram
changes gradually. High horizontal stress still appeared in
neighborhood of depressurization source in the result of after 10
days. However, High vertical stress has appeared on the ground
about 10m away for depressurization source. And the maximum
principal stress vectors are distributed like arch structure over
the upper and lower sides. Moreover it have supported upper
layer. Therefore, settlement of sea bottom hardly appears in
case of short production. It become clear that arching effect
prevent settlement of upper layer and sea bottom by a
depressurized area spreads almost circularly.
Figure 5(b) shows the shear strain distribution at the seabed.
Note that shear strains occur at the boundary of MH-bearing
layer and the upper/lower layer like a wedge as a result of
differential settlement. Shear stress which caused by differential
settlement becomes maximum in 10 days past from
depressurization start, and it reached about 2MPa shear stress
and 3% of shear strain in this analysis.
0
10 20 30 40 50 60 70
-1.0
-0.5
0.0
0.5
1.0
Elapsed time (day)
Point A
Point B
Point C
Point D
Normalized vertical displacement
Figure 3. Distribution of each value around production area.
(d) Vertical displacement
(c) Gas saturation
(b) Hydrate saturation
(a) Water pressure
1 day
10 days
60 days


