753
Technical Committee 103 /
Comité technique 103
simplified continuum model. Fig. 4 shows the mesh that is used
in this study.
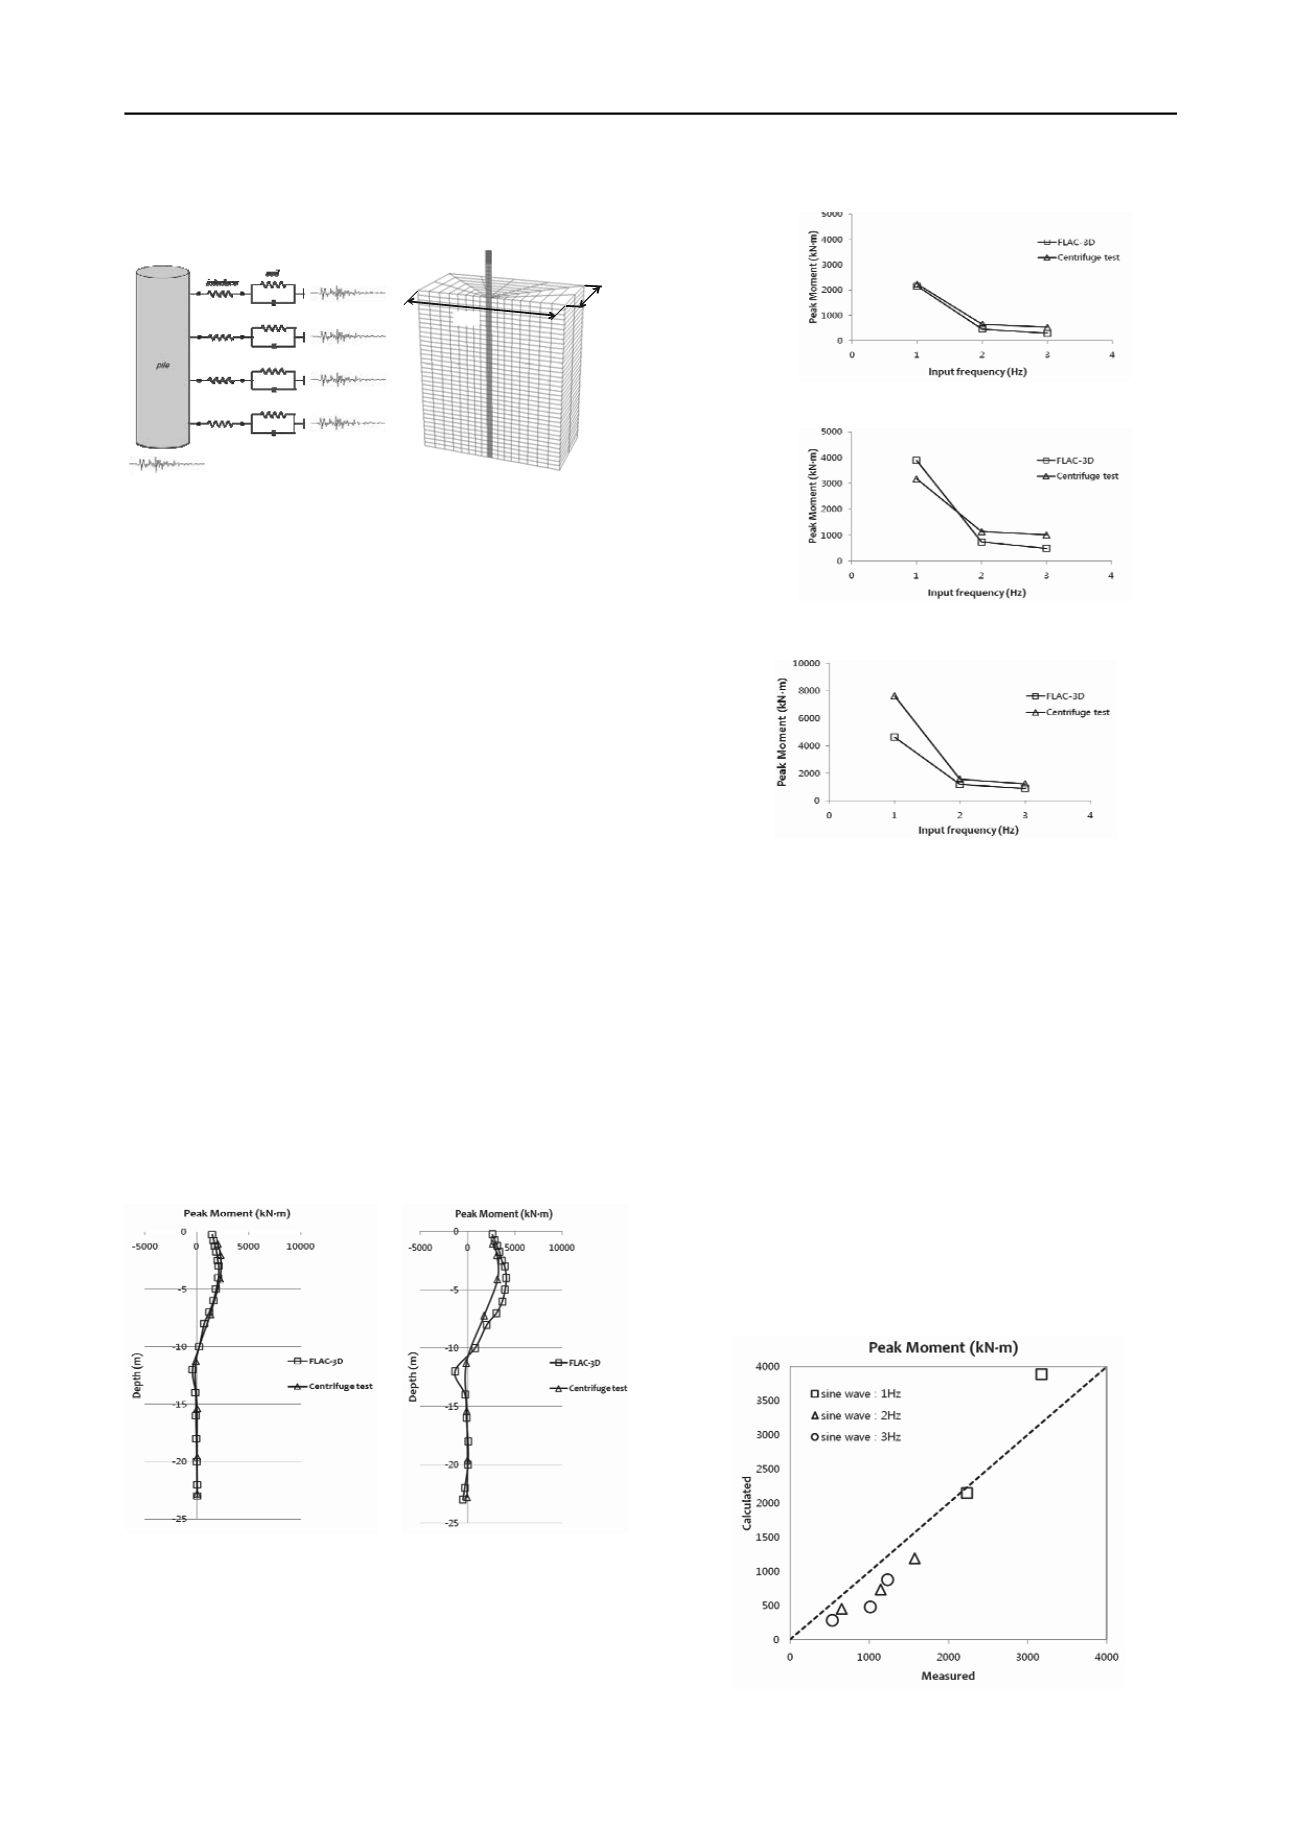
Fig. 3 Simplified continuum
modeling
4 CALIBRATION AND VERIFICATION OF THE
NUMERICAL MODEL
4.1 Calibration of the numerical model
Calibration of the proposed modeling method was performed by
comparing results between dynamic centrifuge tests and 3D
numerical simulation. The case of a pile with a diameter of
100cm and wall thickness of 4cm at the prototype scale was
used in this procedure.
4.1.1 Response to sinusoidal waves
The peak bending moments along the depth, obtained by
experiment and numerical analysis, are shown in Fig. 5. As the
base input acceleration increases, the pile response increases,
both in centrifuge test and FLAC-3D. It is observed that there is
good agreement between the computed and measured values.
The peak bending moment profile obtained from numerical
simulation well predicts the location at which maximum
bending moment occurs, and the infitie depth of the pile. As the
input acceleration increases, the discrepancy between computed
and measured values increases slightly. The average
discrepancy through various input motions was 10%. In
particular, when the input acceleration was 0.13g, the peak
bending moment profiles obtained by experiment and numerical
analysis were almost identical along the depth, as shown in Fig.
5 (a). The peak bending moment
(a) Input acceleration : 0.13g (b) Input acceleration : 0.25g
Fig. 5 Peak bending moment along the pile (1Hz)
10D
20D
pile diameter: D
(a) Input acceleration : 0.13g
Fig. 4 Mesh of the simplified
continuum model
(b) Input acceleration : 0.25g
(c) Input acceleration : 0.45g
Fig. 6 Peak bending moment according to frequency
profiles when the input accleration was 2Hz and 3Hz were
similar to the profile at 1Hz.
The peak moment values varied considerably with the base
input frequency, as shown in Fig. 6. The amplitude of response
became highest for an input frequency of 1Hz. This resonance
occurs both in the centrifuge test and FLAC-3D, which means
that the proposed modeling method is capable of simulating the
important dynamic characteristic. As input acceleration
increases, the discrepancy between the measured value and
computed value increases at 1Hz, due to resonance. In most of
the input motions, the peak bending moment value obtained
from numerical analysis agrees well with that from the
centrifuge test.
Fig. 7 shows a comparison between the peak bending
moments measured in the centrifuge test, and those calculated
in FLAC-3D analysis. All the points are located near the 1:1
line, meaning that the modeling method proposed in this study
has the ability to simulate pile behavior reasonably well.
Fig. 7 Comparison between the test and FLAC
results(sine wave)


