746
Proceedings of the 18
th
International Conference on Soil Mechanics and Geotechnical Engineering, Paris 2013
Proceedings of the 18
th
International Conference on Soil Mechanics and Geotechnical Engineering, Paris 2013
model seepage or piping, nor does it consider large
deformations of the levee due to mudslides or surface fracture.
If these phenomena were modeled, the results may indicate
levee slope as a more important factor during overtopping
conditions.
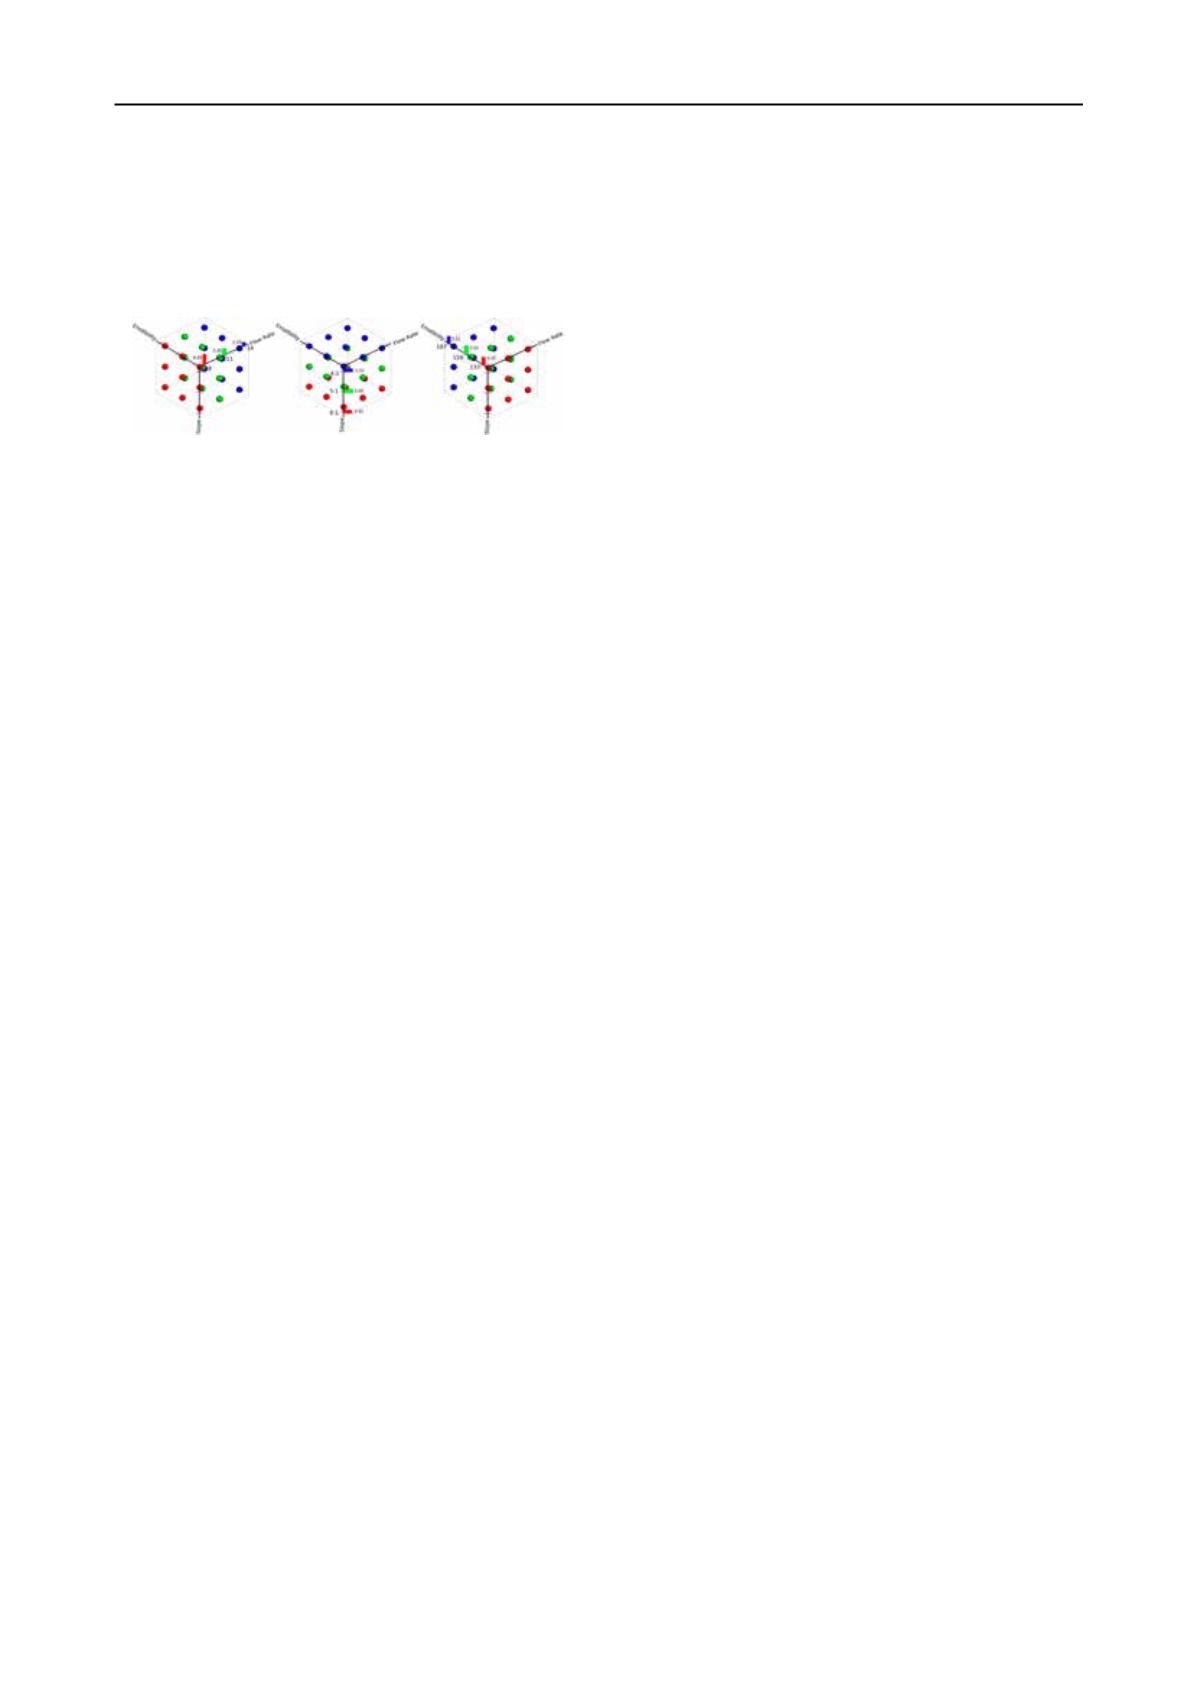
Fig. 5 shows a visualization of the average times to breach
of each experimental flow rate, levee slope, and soil erodibility.
Figure 5 A visualization of the average times to breach of each
experimental flow rate, levee slope, and soil erodibility. Each data
point represents a single erosion simulation, and planes are colored
to represent the points that were used to determine a single
characteristic's average time to breach. For instance, in the left
image, all data sets with a flow rate of 8 mL/s are represented by
red, 11 mL/s by green, and 14 mL/s by blue data points. The bars on
each axis represent the average time to breach of all data points of
the corresponding color, and each image compares averages across a
single characteristic. We can see that levee slope and erodibility
have little effect on the times to breach, whereas flow rate has a
major impact
An interesting outlier in our data was the fastest flow rate
(14 mL/s) and the highest erodibility value (187). All levee
slopes in this category failed within 20 seconds of each other,
and it was not the fastest time to breach, as would be expected.
This result may indicate that there is a critical flow rate past
which any flow is too destructive to adhere to any general
trends. However, it is more likely that this anomaly is a result of
the number of channels witnessed, an additional observation
made of the test results.
The number of channels that formed under each testing
condition was also observed. We designated the number of
channels by two numbers,
n
/
m
, where
n
is the number of
channels visible on the down slope side of the levee, and
m
is
the number of channels that reached full breach during the test.
The majority of tests presented a 1/1 channel result, meaning
exactly one primary channel formed and it reached breach
condition. The majority of tests in which a 2/2 channel
formation was observed had flow rates of 14 mL/s, whereas the
majority of the tests with flow rate of 8 mL/s had a 1/1 channel
condition. The tests with flow rate of 11 mL/s provided both 2/1
and 1/1 channel conditions, but no 2/2.
The large number of tests with fast flow rates and multiple
channel formations could account for the slower breach times
for faster flow rates, as more soil is being eroded from two
different locations along the levee, instead of a single channel.
Since the total eroded volume is higher with faster flow rates,
this appears logical.
As it can be seen, an investigation of various overtopping
quantities dealing with levee erosion has been performed in this
research. Digital simulations have been presented to predict the
time that it would take the levee to breach under different water
flows. Additional centrifuge tests are planned. Since the
breaching in centrifuge tests happens rapidly, some
modification may be needed for the centrifuge tests; e.g. using
cameras with higher quality to capture better images and videos
during and after the tests. It will help to observe and measure
the exact breaching time during centrifuge tests; because even a
few seconds in high “
g
” tests represents a significant amount of
prototype time. The following conclusions can also be drawn
from the study:
1. Higher water flow will lead to smaller t
breach
. That is, in
similar levees with different water flows, breaching would
happen faster in the one which undergoes a higher water flow.
2. At higher water flows, most of the water will overtop the
levee and the amount of water that seeps through the levee is
negligible compared to overtopped water.
3. At smaller water flows (smaller than 0.4 lit/min), the
amount of water that seeps through the soil is significant
compared to the amount of water that overtops.
4. At small water flows, seepage plays a significant role on
controlling the erosion. That is, long term seepage may
eventually cause failure, but for short times it tends to reduce
erosion.
4 ACKNOWLEDGEMENTS
This material is based upon work supported by the National
Science Foundation under Grant No. 0835762.
5 REFERENCES
Briaud, J. L., Chen H. C., Govindasamy, A. V., and Storesund, R.
(2008). “Levee erosion by overtopping in New Orleans during the
hurricane
Katrina.”
Journal
of
Geotechnical
and
Geoenvironmental Engineering, ASCE
, 134: 618-632.
Chen, Z., Stuetzle, C. S., Cutler, B., Gross, J. A., Franklin, W. R, and
Zimmie, T. F. (2011). “Analyses, simulations and physical
modeling validation of levee and embankment erosion.”
Proceedings of Geo-Frontiers, Advances in Geotechnical
Engineering
, Dallas, Texas, USA.
Chen, Z., Stuetzle, C. S., Cutler, B., Gross, J. A., Franklin, W. R., and
Zimmie, T. F. (2010). “Quantitative analysis of simulated erosion
for different soils.”
18th ACM SIGSPATIAL International
Conference on Advances in Geographic Information Systems
(ACM SIGSPATIAL GIS 2010),
San Jose, CA, USA
.
Dean, R.G., Rosati, J.D., Walton, T.L., and Edge, B.L. (2010).
“Erosional equivalences of levees steady and intermittent wave
overtopping.”
Ocean Engineering
, 37: 104-113.
Gingold, R. A., and Monaghan, J. J. (1977). “Smoothed particle
hydrodynamics: Theory and application to non-spherical stars.”
Monthly Notices of the Royal Astronomical Society
, 181: 375-389.
Griffis, F.H. (Bud). (2007). “Engineering failures exposed by Hurricane
Katrina.” Technology in Society, Vol. 29, 2, pp 189-195.
Holmes, D. W., Williams, J. R., and Tilke, P. (2011). “Smooth particle
hydrodynamics simulations of low Reynolds number flows
through porous media.”
International Journal for Numerical and
Analytical Methods in Geomechanics
, 35: 419-437.
Kamalzare, M., Stuetzle, C., Chen, Z., Zimmie, T., Cutler, B., and
Franklin, W. (2012).” Validation of Erosion Modeling: Physical
and numerical “GeoCongress 2012”, Oakland, California, USA.
Kristof, P., Benes, B., Krivanek, J., and Stava, O. (2009). “Hydraulic
erosion using smoothed particle hydrodynamics.”
Computer
Graphics Forum
, 28: 219-228.
Muller, M., Charypar, D., and Gross, M. (2003). “Particle-based fluid
simulation for interactive applications.”
ACM SIGGGRAPH
/Eurographics Symposium on Computer Animation
,: 154-159.
Sills, G. L., Vroman, N. D., Wahl, R. E., and Shwanz, N. T. (2008).
"Overview of New Orleans Levee Failures: Lessons Learned and
Their Impact on National Levee Design and Assessment."
Journal
of Geotechnical and Geoenvironmental Engineering, ASCE
,
134(5): 556-565.
Toon, B. A., and Dutr, P. (2008). “Porous flow in particle-based fluid
simulations.”
ACM Transactions on Graphics (TOG)
,27 (3),
Article No. 49.
U.S. Army Corps of Engineers (USACE). (2000). Design and
Construction of Levees. Engineer Manual. Washington D.C.:
Department of the Army.
Wan, C. F., and Fell, R. (2004). "Investigation of Rate of Rate of
Erosion of Soils in Embankment Dams."
Journal of Geotechnical
and Geoenvironmental Engineering, ASCE
, 130(4): 373-380.
Xu, Y., and Zhang, L. M. (2009). "Breaching Parameters for Earth and
Rockfill Dams."
Journal of Geotechnical and Geoenvironmental
Engineering, ASCE
, 135(12): 1957-1970.


