744
Proceedings of the 18
th
International Conference on Soil Mechanics and Geotechnical Engineering, Paris 2013
Proceedings of the 18
th
International Conference on Soil Mechanics and Geotechnical Engineering, Paris 2013
benchmarks. Although much work has been done to simulate
erosion, very little of the results have been validated.
A primary objective of this research was validation of the
computer simulation by laboratory experimentation. Therefore
in this paper, laboratory tests with different soils have been
performed to improve the computer simulations of levee
erosion. Some tests had been performed using different
mixtures of two soils, and the effects of different percentages of
clay had been investigated (Kamalzare et al. 2012). The
emphasis of this paper was to investigate the effect of water
flow on the erosion. Therefore, all the tests were performed on
one mixture of soil but various water flow rates were used. To
better evaluate the effects of water flow on real levees, some
centrifuge tests have also been performed which simulate full
scale prototype levees and embankments.
2 TEST MATERIALS AND PROCEDURES
A mixture of two soils have been used in the tests represented
herein, a clay soil (Kaolinite Clay) and a granular soil (Nevada
120 Sand). Tests were performed on mixtures of 25% clay and
75% sand. Maximum dry density and optimum water content of
the sand and clay were 16.4kN/m
3
and 11% for the sand and
12.8kN/m
3
and 29% for the clay respectively. Table 1 lists the
physical characteristics of the mixed soil.
Table 1. Soil Characteristics
Property
Mixed soil
D
10
(mm)
0.074
D
30
(mm)
0.11
D
60
(mm)
0.19
Coefficient of uniformity
2.57
Coefficient of curvature
0.86
Liquid limit
17
Plastic limit
11
Permeability
10e-5 cm/s
USCS symbol
SC
The maximum dry unit weight for the soil sample was
15.4kN/m
3
. Samples were prepared to achieve a relative density
of 90% of the maximum dry density (13.9kN/m
3
) and used the
optimum water content (10%) which has been calculated
according to AASHTO T99-70 / ASTM D698-70 (A-method).
The models used in this research were constructed in an
aluminum box. The geometry of the model levee was
determined similar to conventional levees before construction of
the model began. Some tests were also performed in boxes with
different sizes to find the effect of levee dimensions on the
results. The compaction of soil was conducted manually by
using a plastic hammer to strike the steel plate, which was
placed on top of the soil until reaching the target unit weight.
The erosion processes described in this paper refer to hydraulic
erosion. Small-scale erosion on earthen embankments is being
studied, modeled and eventually simulated, with respect to the
formation of rills and gullies. Validation of the simulation is a
primary focus in this research, so scaled-down model levees are
used to perform erosion experiments at “1-
g
” and at higher
levels of “
g
” in a geotechnical centrifuge. The results of
experiments to date are presented in the following sections.
Different water flows were used and complex geometries and
boundary conditions utilized to quantitatively assess the effects
of differing conditions. The physical models serve as the basis
for developing accurate, digital simulations of the embankment
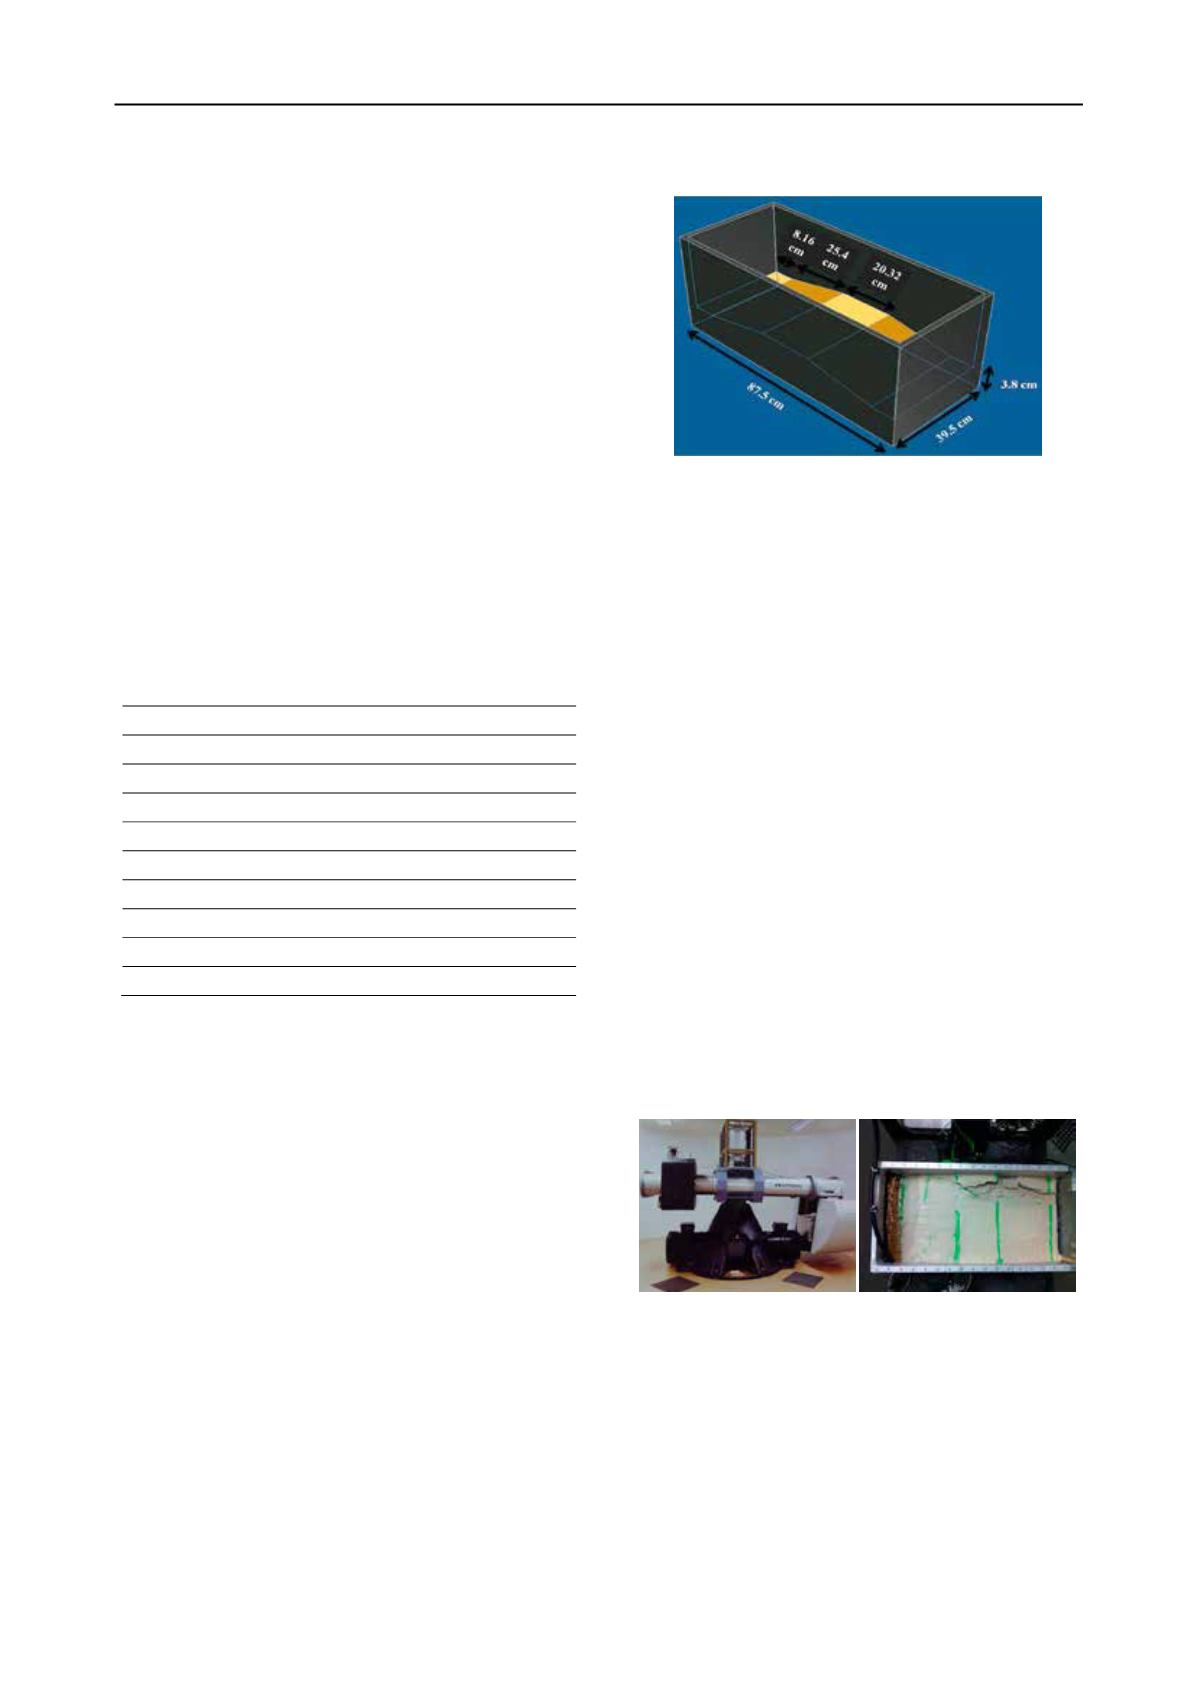
erosion processes. To illustrate the dimensions of the levee, a
schematic picture of the model is shown in Fig. 1.
Figure 1. Dimensions of the modeled levee in the medium box
The time elapsed from initiation of initial rill erosion began at
the crest of the landside slope to the time the eroded channel
reached the crest on the waterside slope (t
breach
) was measured
during the tests. Photographs and videos were taken before,
during and after each test. The width and depth of the rills were
also measured after failure of the levee.
In order to simulate some large scale measurements
centrifuge tests were performed at 25g’s (Fig. 2(a)). Since in
high ”
g
” tests water will be heavier, erosion will occur much
faster than “1-
g
”. A high speed camera with capability of
60,000 pictures per second (pps) was used to take pictures and
record videos during the tests in centrifuge. Three other cameras
were also recording videos from different angles. These videos
and pictures were being used to evaluate the results of digital
simulations and computer predictions.
Fig. 2(b) shows a levee after a centrifuge test. The green lines
are colored sand that was used for the purpose of better viewing
in the crest of the levee. Since the water is 25 times heavier in
this centrifuge test, pebble size sands overlaying a piece of
geotextile were used in the left side of the box, where water was
added to the levee from a hose, to prevent erosion. To collect
the overtopped water, an empty space was left underneath the
levee. The overtopped water passed through a small gap in the
right side of the levee and was collected underneath the levee.
The erosion time was about 5 minutes for a water flow equal to
0.56 lit/min. However in the centrifuge time and dimensions
will scale by ”
g
”, and this would be equal to 100 minutes in full
scale prototype time. The tested levee would also simulate a
17.50m long prototype levee with 1.78m height and 7.90m
width.
(a) (b)
Figure 2. (a). RPI 150
g
-ton geotechnicall centrifuge, (b). The eroded
levee after the centrifuge test
To model the system numerically, the high resolution
particle-based Lagrangian methods based on Smooth Particle
Hydrodynamics (SPH) was used, which was first presented by
Gingold et al. (1977). This method is based on the Navier-
Stokes equations and discretized into a set of particles. The
solution is based on momentum and mass conservation
equations:
/ + ∇() = 0
(1)
(/ + . ∇) = −∇ + + ∇^2
(2)


