766
Proceedings of the 18
th
International Conference on Soil Mechanics and Geotechnical Engineering, Paris 2013
Table 1. Material parameters, north tower.
ID
Top
level
[m]
[kN /m
]
[MPa] [
°
]
[kPa]
[
°
]
[kPa]
Gravel
-40.0
18.0
78
45
-
51.5
-
N1
-43.0
17.5
411
40
-
28.0
-
N1A
-47.0
18.0
411
35
-
24.0
-
N2
-51.5
18.6
348
-
77 to
96
-
24.2
to
45.3
N3/5
-60.5
19.0
265
38
-
26.4
-
9
-64.5
18.9
239
-
104
to
341
-
53.6
to
214.3
10
-177.1
(to -
184.7)
18.9
239
-
400
Table 2. Material parameters, south tower.
ID
Top
level
[m]
[kN /m
]
[MPa] [
°
]
[kPa]
[
°
]
[kPa]
Gravel
-40.0
18.0
77
45
-
51.5
-
S2
-43.0
17.6
203
-
41 to
70
-
10.7
to
41.4
S3
-59.5
18.9
78
33
-
22.3
-
S4
-63.5
18.9
161
-
107
to
137
-
54.3
to
80.8
5
-78.5
20.9
575
35
-
6
-96.0
20.1
133
-
241
to
268
7
-112.5
21.1
104
40
-
8
-137.5
(to -
200.0)
20.9
387
-
300
All soils and the gravel bed are modelled with the Mohr-
Coulomb material model with a Poisson's ratio
= 0.3
. All
soils are modelled as undrained materials using the effective
strength parameter
for sand layers and the undrained shear
strength
for clay layers.
The gravel bed is modelled as a drained material. Stiffness
values corresponding to the equivalent shear moduli from the
site response analyses in ProShake are applied. Table 1 and 2
show the stiffness values for the NCE seismic event. For the
FEE and SEE, the values are higher due to the lower strain
levels in these seismic events.
The piles are modelled as linear elastic-perfectly plastic with
equivalent stiffness parameters due to the 2D plane strain
modelling. Plastic bending moments of 14.5 MNm and 22.2
MNm are defined in the models for the north and south tower,
respectively, corresponding to the moments for which the
characteristic structural capacities of the piles are fully utilized.
The base resistance of the 2 m diameter piles is assumed to
be negligible. Shaft resistance is modelled using the interface
strength parameters listed in Table 1 and 2. Undrained shear
strength and consequently interface strength are defined as
increasing from a value at the top of the layer to a value at the
bottom of the layer. The interface strength parameters account
for the differences between the actual geometry and the 2D
plane strain approximation.
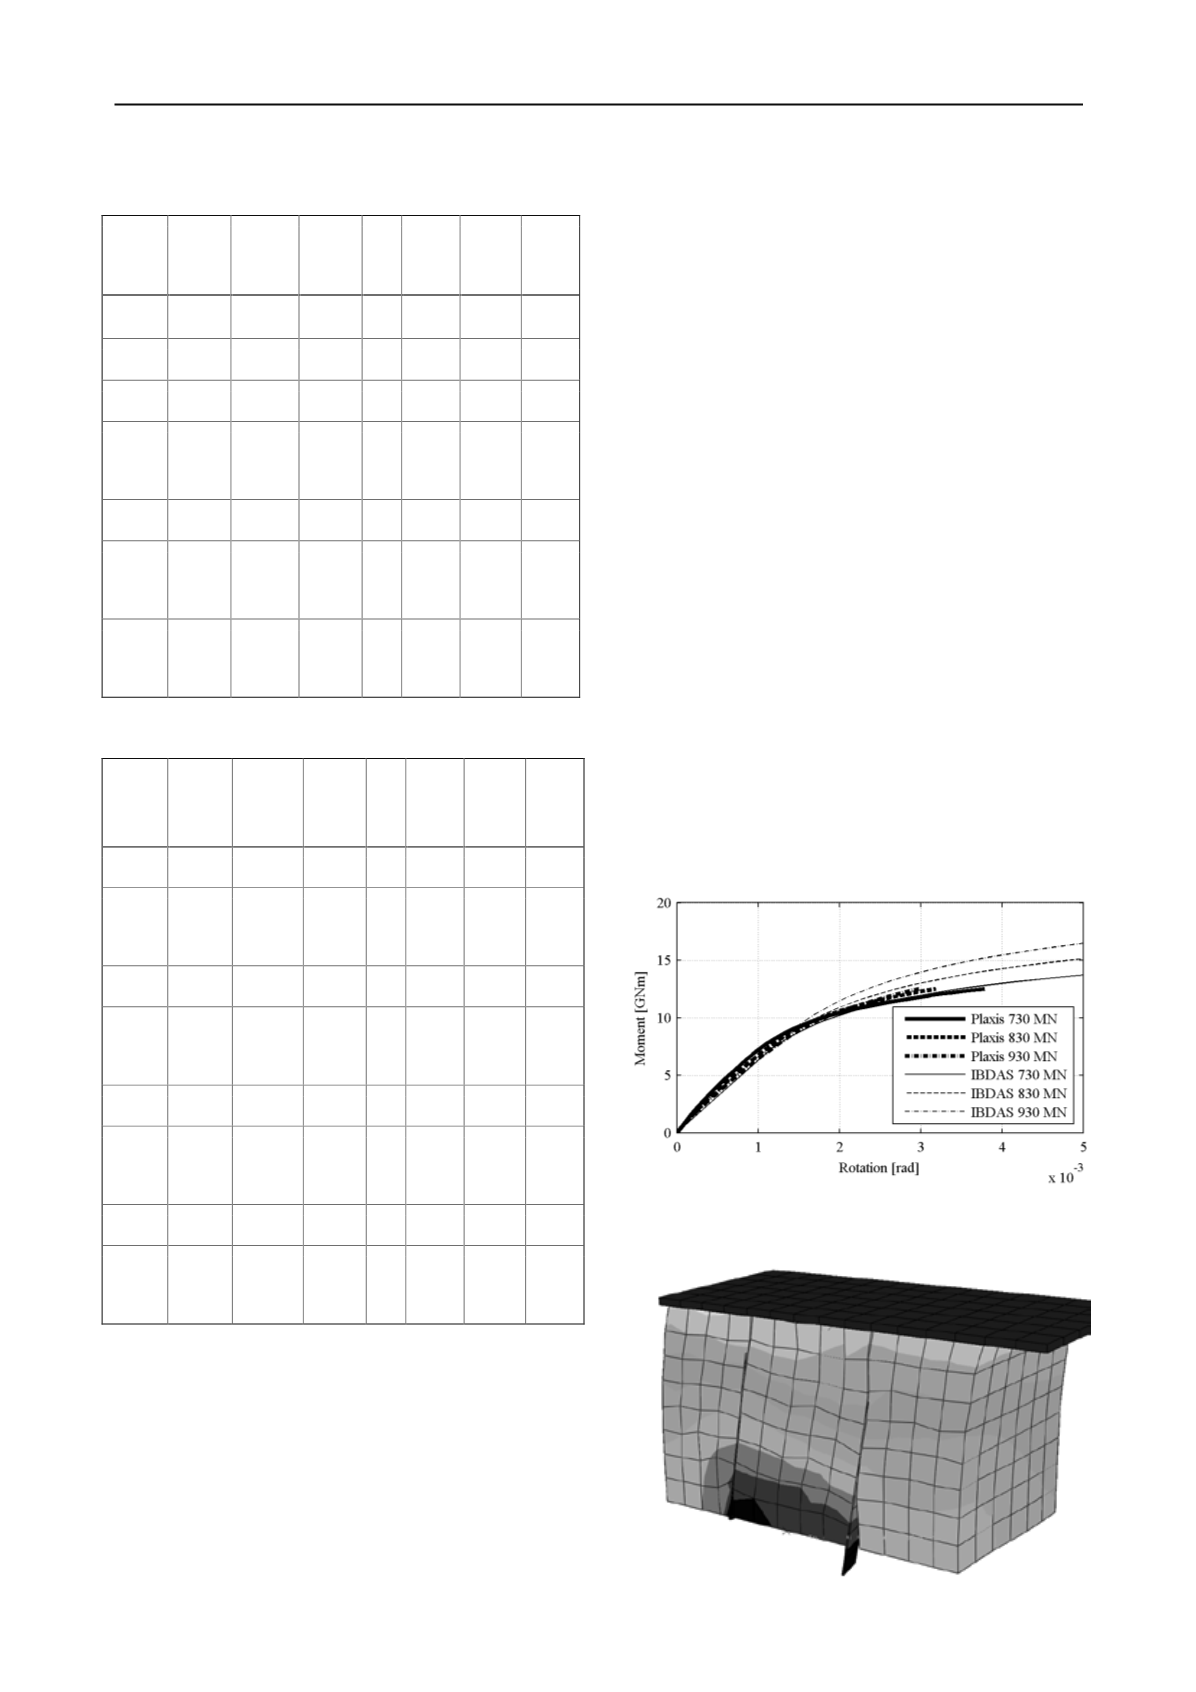
A reasonable agreement between the overturning behaviour
in the IBDAS model and the 2D Plaxis model can be achieved
with vertical soil spring stiffnesses of
= 9.0MPa/m ∙
A
and
= 4.5MPa/m ∙ A
at the north and south tower,
respectively. This is illustrated for the north tower in Figure 9.
4.3
Horizontal gravel springs
A 3D finite element model in Abaqus is used to determine the
load-displacement behaviour of the gravel bed. Exploiting
symmetry, a 5 m wide, 2.5 m deep and 3 m high gravel body
with one half of a pile is used to represent one pile in an
infinitely large pile group, as shown in Figure 10.
The front, back and bottom face of the gravel body are
constrained in normal direction, while repetitive boundary
conditions (Law and Lam 2001) are applied to the left and right
sides. The pile is only allowed to rotate around its base.
Coulomb friction contact is modelled between the stiff caisson
bottom slab and the gravel with a friction coefficient
= 0.7
.
Coulomb friction contact is also modelled between the inside
and outside of the pile and the gravel with a friction coefficient
= 0.4
.
Figure 9. Calibration of vertical soil springs at the north tower by
matching the overturning behaviour in the IBDAS model with the
overturning behaviour in the 2D Plaxis model.
Figure 10. 3D Abaqus model for determination of gravel bed springs.


