775
Technical Committee 103 /
Comité technique 103
3 PARAMETRIC STUDY
Parametric studies were carried out with different combinations
of facing type, reinforcement stiffness, compaction efforts, and
shear resistance parameter of the backfill soil. In these analyzes
the same geometry of the validation model was considered.
Facing type was evaluated considering block and wrapped
facing wall. No compaction condition and compaction effort
equal to 120 kPa were considered in addition to the 63 kPa
compaction effort used for model validation. The modular
blocks were simulated as linear elastic units. The interface
property defined by Hatami and Bathurst (2006) was used to
simulate the block-block interface. Table 2 presents the value of
the parameters used in the performed analyzes. Note that
is
the relative soil-reinforcement stiffness index (Ehrlich and
Mitchell, 1994), calculated by
S
i
= J
r
/
kP
a
S
v
(2)
where
J
r
is the tensile stiffness modulus of reinforcement,
S
v
is
the vertical reinforcement spacing,
P
a
is the atmospheric
pressure and
k
is the modulus number (hyperbolic stress-strain
curve model).
Figure 4. Model geometry used in parametric study.
Table 2. Input parameters used for parametric study.
Parameter
Value
Modular block properties
Model
Linear elastic
Size, (m × m)
0.4 × 0.2
(length × height)
Unit weight
γ
(kN/m
3
)
21.8
Poisson´s ratio
υ
0.15
Stiffness modulus (kPa)
1 × 10
6
Block-block interface
Friction angle (
o
)
57
Cohesion (kPa)
46
Soil-reinforcement stiffness index
S
i
0.01, 0.025, 0.1, 0.25, 1
Backfill soil
friction angle
(
o
)
20, 35, 50
Cohesion
c
(kPa)
1, 10
Compaction effort (kPa)
0, 63, 120
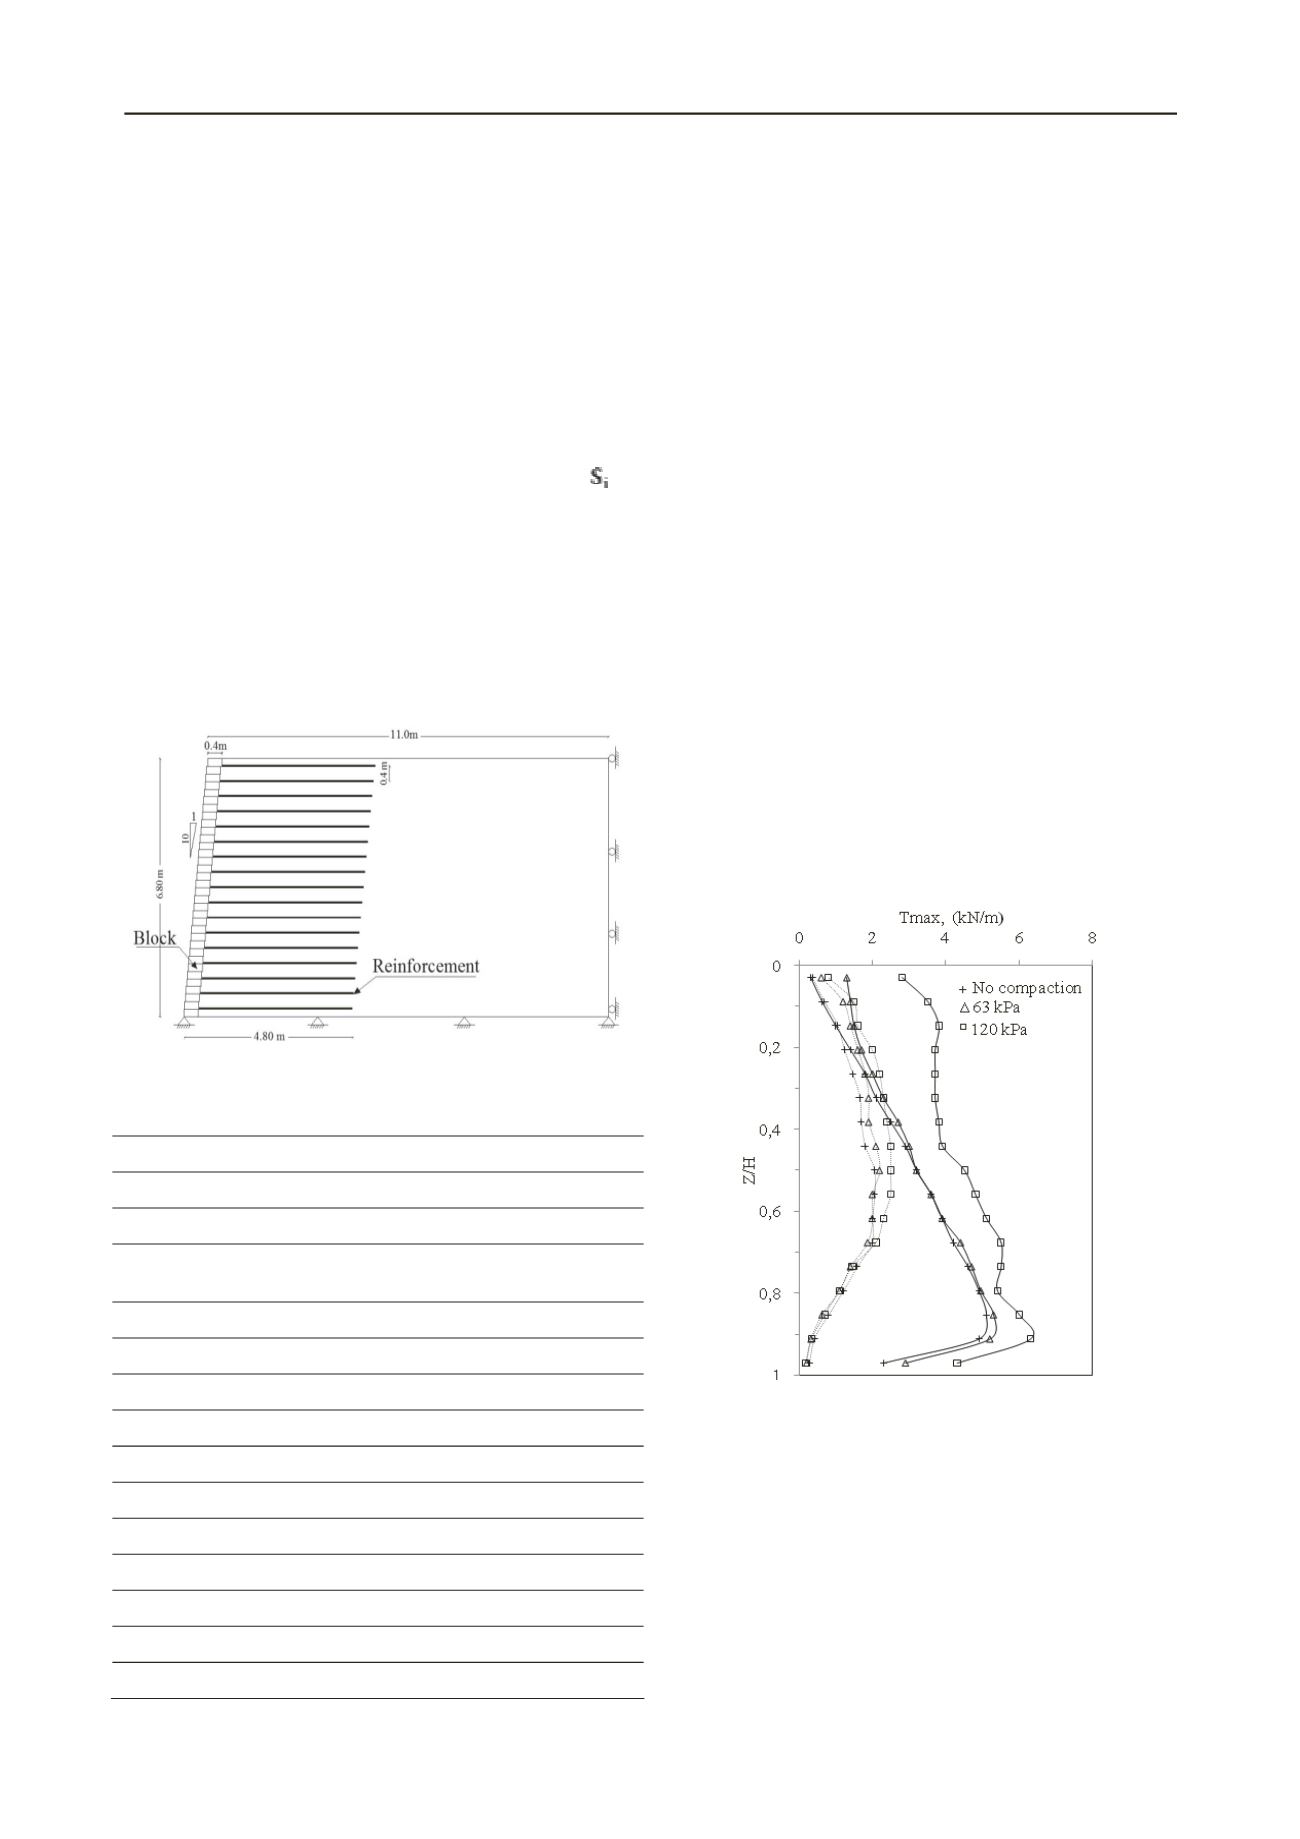
4 RESULTS
Fig. 5 shows the values of T
max
versus depth for different
compaction efforts (i.e., no compaction, 63 kPa, and 120 kPa)
for block (dotted line) and wrapped (solid line) faced walls. In
performed analyses reinforcement stiffness index, S
i
, equal to
0.025 was assumed. Comparison of the curves related to the
results considering or not considering the induced stress due to
compaction shows a very consistent representation of the
expected behavior for block and wrapped faced walls. For a
depth greater than the compaction influence depth, i.e., Z > Z
c
,
the effect of compaction vanishes because the geostatic stress
overcomes the induced stress due to the backfill soil compaction
and T
max
for the analyzes considering or not considering the
induced stress due to backfill soil compaction would be the
same. Z
c
is given by σ´
zc,i
divided by the soil unit weight
(σ´
zc,i
/γ). However, for depths lower than the compaction
influence depth (Z < Z
c
), T
max
would be greater than the
corresponding values for the condition of no compaction. This
behavior is verified in both models with different facing types.
These results agree with the reported physical modeling results
by Ehrlich et al. (2012), which evaluated the effect of
compaction on the behavior of GRS walls.
In addition, Fig. 5 indicates that for the block faced wall, the
maximum tension in the reinforcement occurred almost in the
reinforcements placed at the mid-wall height. However, for the
wrapped faced wall, the maximum value occurred at a lower
level (close to the bottom of the wall). The difference in this
behavior might be attributed to the combined effect of facing
stiffness and toe resistance, which is different in these two types
of wall.
Figure 5.Values of T
max
versus depth for different compaction efforts.
Solid and dotted lines represent wrapped and block faced walls,
respectively.
Fig. 6 presents the values of the summation of T
max
versus
different reinforcement stiffness for block and wrapped faced
wall. In this figure, the solid and dashed lines represent results
related to the backfill soil modeled with cohesion values equal
to 1 kPa and 10 kPa, respectively.
Fig. 6 shows that for both facing types, the value of
summation of maximum tension in the reinforcement, ∑ T
max
,
increases with reinforcement stiffness. For the wrapped faced
wall, the rate of increase of ∑T
max
for the lower reinforcement
stiffness is less compared with the verified ones for the higher
values of S
i
. However, for the block faced wall, this rate is
almost constant, irrespective of the reinforcement stiffness
values. Furthermore, comparison of the curves related to


