776
Proceedings of the 18
th
International Conference on Soil Mechanics and Geotechnical Engineering, Paris 2013
different cohesions, i.e., 1 kPa and 10 kPa, displays that lower
cohesion led to a greater value of ∑T
max
, irrespective of facing
type. For the wrapped face wall, the difference between the
determined values of ∑T
max
was greater for lower values of S
i
,
where the cohesion of the backfill soil was assumed equal to 1
kPa and 10 kPa. Note that the difference in the determined
results decreased with an increase of S
i
. However, for block
facing the inverse behavior was verified. This discrepancy
might be related to toe resistance and lateral movement
restriction verified in the block faced wall, compared with the
mobilized one in the wrapped faced wall.
5 CONCLUSIONS
In this paper, the behavior of reinforced soil walls was studied
through numerical analyzes carried out using the finite element
method. The numerical analysis was performed using the
PLAXIS 2D computer code. The modeling was verified with
the results of a full-scale reinforced soil wall experiment
performed at the Geotechnical Laboratory of COPPE/UFRJ.
Comparison of measured maximum reinforcement tensile stress
and values predicted by both PLAXIS and the Ehrlich and
Mitchell (1994) method show good agreement. In addition,
parametric studies were carried out with different combinations
of: facing type, reinforcement stiffness, compaction efforts, and
shear resistance parameters of the backfill soil. Analysis of the
results showed that:
Comparison of the results for different values of compaction
effort shows that for depths greater than the compaction
influence depth, i.e., Z > Z
c
, the effect of compaction vanishes
because the geostatic stress overcomes the induced stress due to
backfill soil compaction and the maximum tension in the
reinforcement, T
max
, for the analyzes considering or not
considering the induced stress due to backfill soil compaction
would be the same. However when Z < Z
c
, T
max
would be
greater than the corresponding values for the condition of no
compaction.
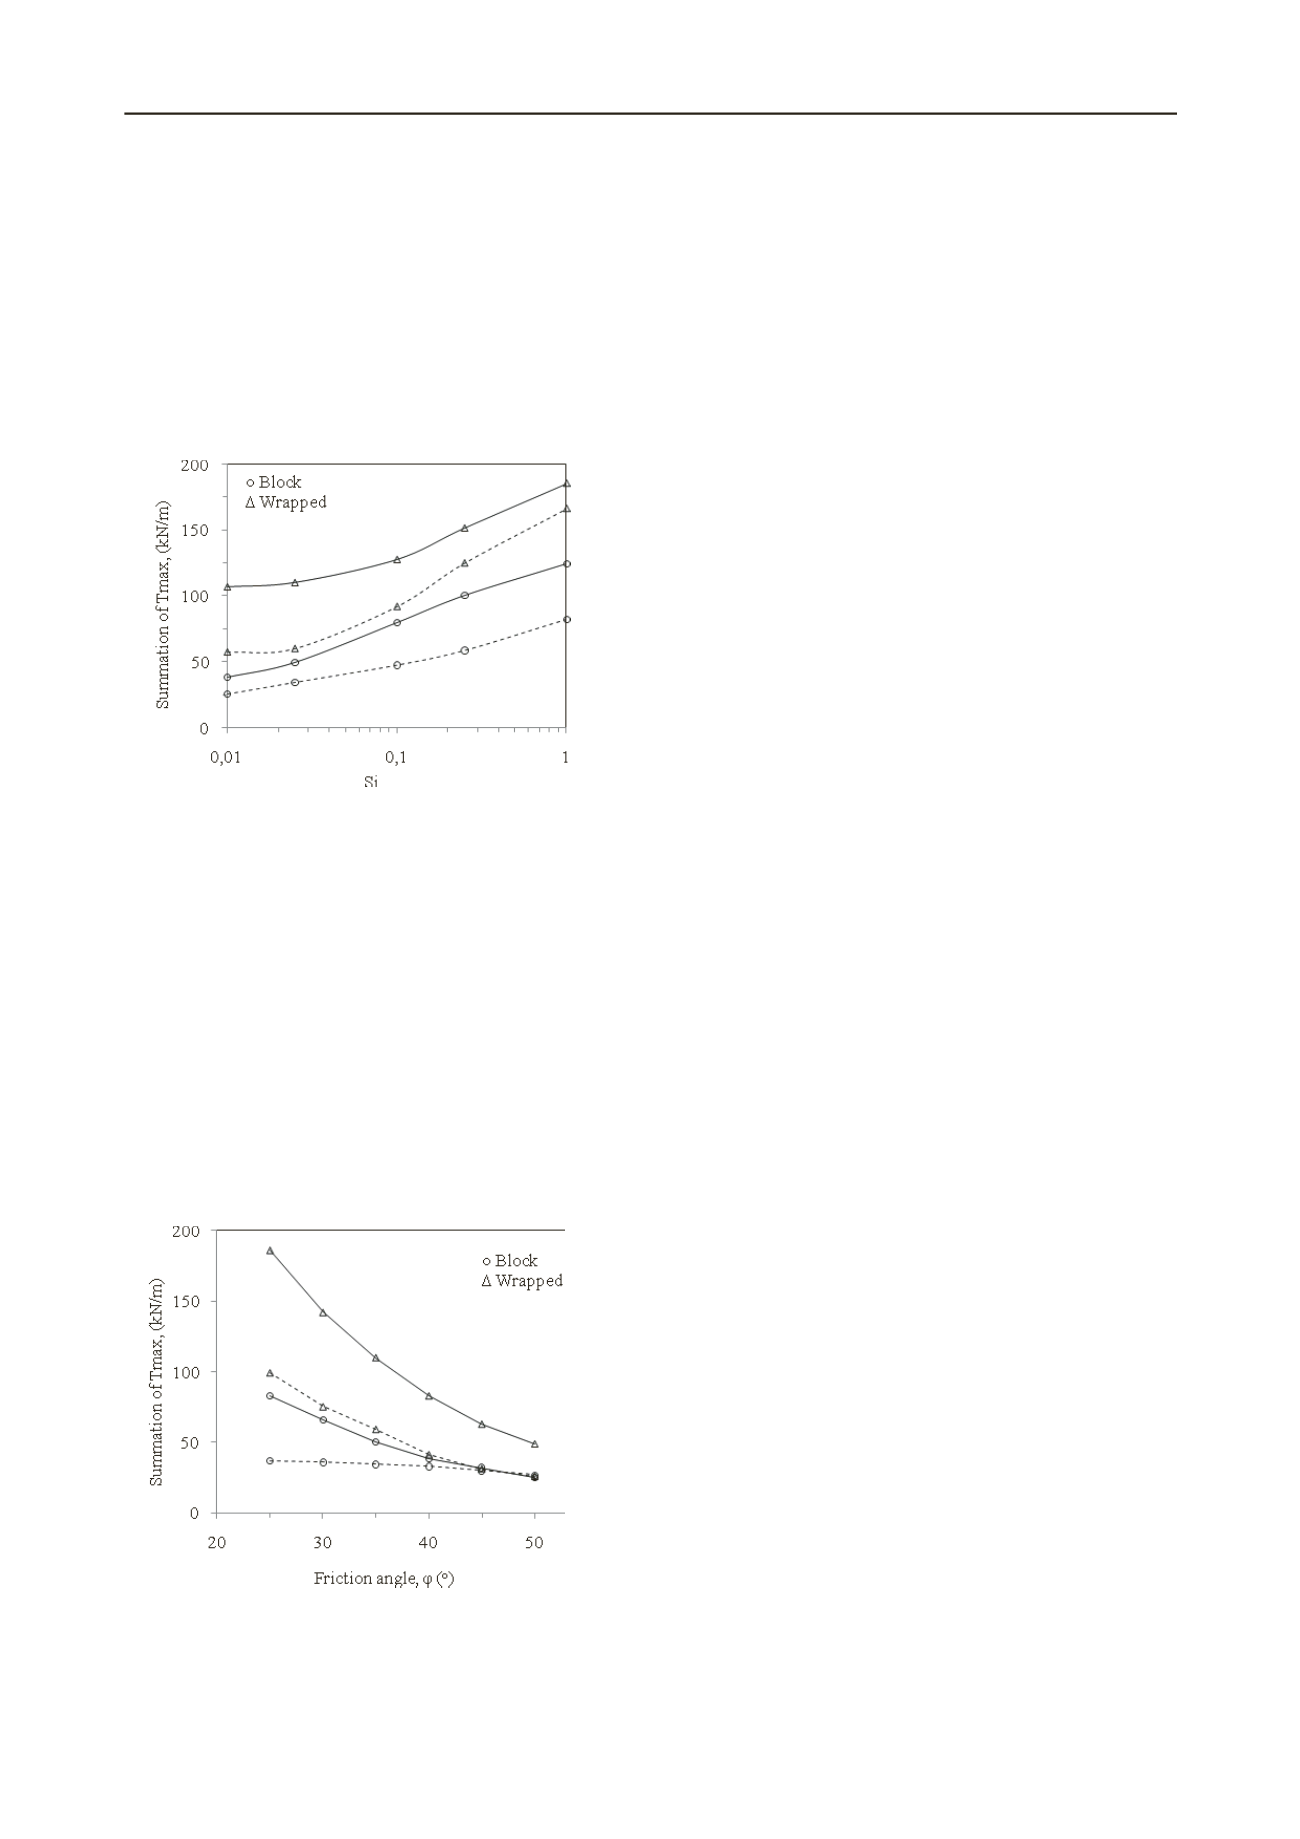
Figure 6.Values of the summation of T
max
versus reinforcement stiffness
for no compaction condition and different facing types. Solid line:
cohesion equal to 1 kPa, dashed line: cohesion equal to 10 kPa.
Fig. 7 indicates the values of the summation of T
max
versus
friction angle of the backfill soil, determined in the performed
analyzes considering block and wrapped faced walls. In this
figure, the solid and dashed lines represent results related to the
wall in which the backfill soil is modeled with cohesion values
equal to 1 kPa and 10 kPa, respectively. As shown for both the
block and wrapped faced walls, ∑T
max
declines with an increase
of the backfill soil friction angle. However, the rate of decrease
for the wrapped faced wall is greater than that of the block faced
wall, and this behavior was clearer for the wall where the
backfill soil was modeled with a cohesion value equal to 10
kPa. Fig. 7 also shows that for the wall where the backfill soil
was modeled with a greater friction angle, ∑T
max
is less affected
by the magnitude of the backfill soil cohesion. This behavior
can be clearly seen for the block faced wall.
The summation of the maximum tension in the
reinforcement ∑T
max
, increases with reinforcement stiffness.
For the wrapped faced wall, the rate of increase of ∑T
max
for the
lower reinforcement stiffness is less compared with the higher
ones. However, for the block faced wall, this rate is almost
constant, irrespective of the reinforcement stiffness value.
∑T
max
for the walls modeled with greater backfill soil cohesion
is less than that for those with lower backfill soil cohesion,
irrespective of facing type. For block faced wall, for analyzes
where the cohesion of backfill soil was assumed equal to 1 kPa
and 10 kPa, the difference between ∑T
max
for lower
reinforcement stiffness values was less compared with higher
reinforcement stiffness. However, for the wrapped faced wall,
the inverse behavior was verified.
An increase of backfill soil friction angle leads to lower
values of ∑T
max
. However, the rate of decrease for the wrapped
faced wall is greater than that for the block faced wall.
Furthermore, for walls in which the backfill soil was modeled
with greater friction angle, ∑T
max
is less affected by the
magnitude of the backfill soil cohesion.
6 REFERENCES
Brinkgreve, RBJ., Vermeer, PA. (2002). “PLAXIS: nite element code
for soil and rock analyses.” version 8. Balkema.
Duncan, J. M., Chang, C. Y. (1970). “Nonlinear analysis of stress and
strain in soil.” Journal of the Soil Mechanics and Foundations
Division, ASCE, 96, No. 5, pp. 1629–1653.
Ehrlich, M., Mirmoradi, S.H., Saramago, R.P. (2012). “Evaluation of
the effect of compaction on the behavior of geosynthetic-reinforced
soil walls.” Geotextiles and Geomembranes 34, pp. 108-115.
Ehrlich, M., Mitchell, J.K. (1994). “Working stress design method for
reinforced soil walls.” J. Geotech. Eng., ASCE, Vol. 120 (4), pp.
625-645.
Guler, E., Hamderi, M., Demirkan, M. M. (2007). “Numerical analysis
of reinforced soil-retaining wall structures with cohesive and
granular backfills.” Geosynthet. Int. J., 14, No. 6, pp. 330-345.
Hatami, K., and Bathurst, R.J. (2006). “A numerical model for
reinforced soil segmental walls under surcharge loading.” J.
Geotech. Geoen. Eng., ASCE, 132(6), pp. 673–684.
Figure 7. Values of the summation of T
max
versus friction angle of the
backfill soil for no compaction condition and different facing types.
Solid line: cohesion equal to 1 kPa, dashed line: cohesion equal to 10
kPa.
Ling, H. I., and Leshchinsky, D. (2003). “Finite element parametric
study of the behavior of segmental block reinforced-soil retaining
walls.” Geosynthet. Int. J., 10(3), pp. 77–94.
Romstad, K.M., Herrmann, L.R., and Shen, C.K. (1976). “Integrated
Study on Reinforced Earth - I: Theoretical Formulation.” J.
Geotech. Eng., ASCE, Vol. 102, No. GT5, pp. 457-472.


