782
Proceedings of the 18
th
International Conference on Soil Mechanics and Geotechnical Engineering, Paris 2013
each element behavior along its individual streamline, the
method utilizes topological ordering based on upstream
weighting, and calculates the cumulative information within the
flow direction. The use of this method allows consideration of
various aspects of soil behavior, including rate effect, strain
softening and anisotropy. General agreement between the
results of
this method and the numerical “re
-meshing
”
method
of Zhou and Randolph (2007, 2009) exists. It should be noted
that the upstream weighting method has the engineering
advantage of being an upper-bound solution, and thus
necessarily conservative for evaluating strength values from
penetration resistance.
3 SOIL STRENGTH
The soil strength might be modified due to different soil effects.
The formulation of the undrained shear strength in this work
describes shear rate strengthening,
f
r
, strength degradation due
to accumulation of shear strains,
f
ss
, and due to the influence of
large rotations in anisotropic soils,
f
an
. The effect of these three
factors on the undrained shear strength is given by:
0
u an ss r
u
s f f f
s
(1)
where
s
u
is the undrained shear strength and
s
u0
is the reference
(undisturbed) undrained shear strength. The above soil strength
effects were rigorously studied and presented below:
3.1. Strain rate effect:
The strain rate factor used in this work is based on Dayal and
Allen (1975), and is the basis of many other works (e.g.,
Randolph, 2004, Einav and Randolph, 2005, Yafrate and
DeJong, 2007, Klar and Osman, 2008, Klar and Pinkert, 2010,
Zhou and Randolph, 2007&2009), given by:
1,
max
log 1
0
ref
u
u
s
s
(2)
where
is the maximum engineering shear strain
rate
3 1
,
ref
is the reference shear rate associated with
s
u0
(1%/hour for standard CU triaxial test) and
is the soil
viscosity parameter. Yafrate et al. (2009) suggested extracting
directly from the global resistance of two penetration tests at
different penetration rates using the same logarithmic relation as
Eq. 2, applied directly on the velocity. Pinkert (2012) utilized
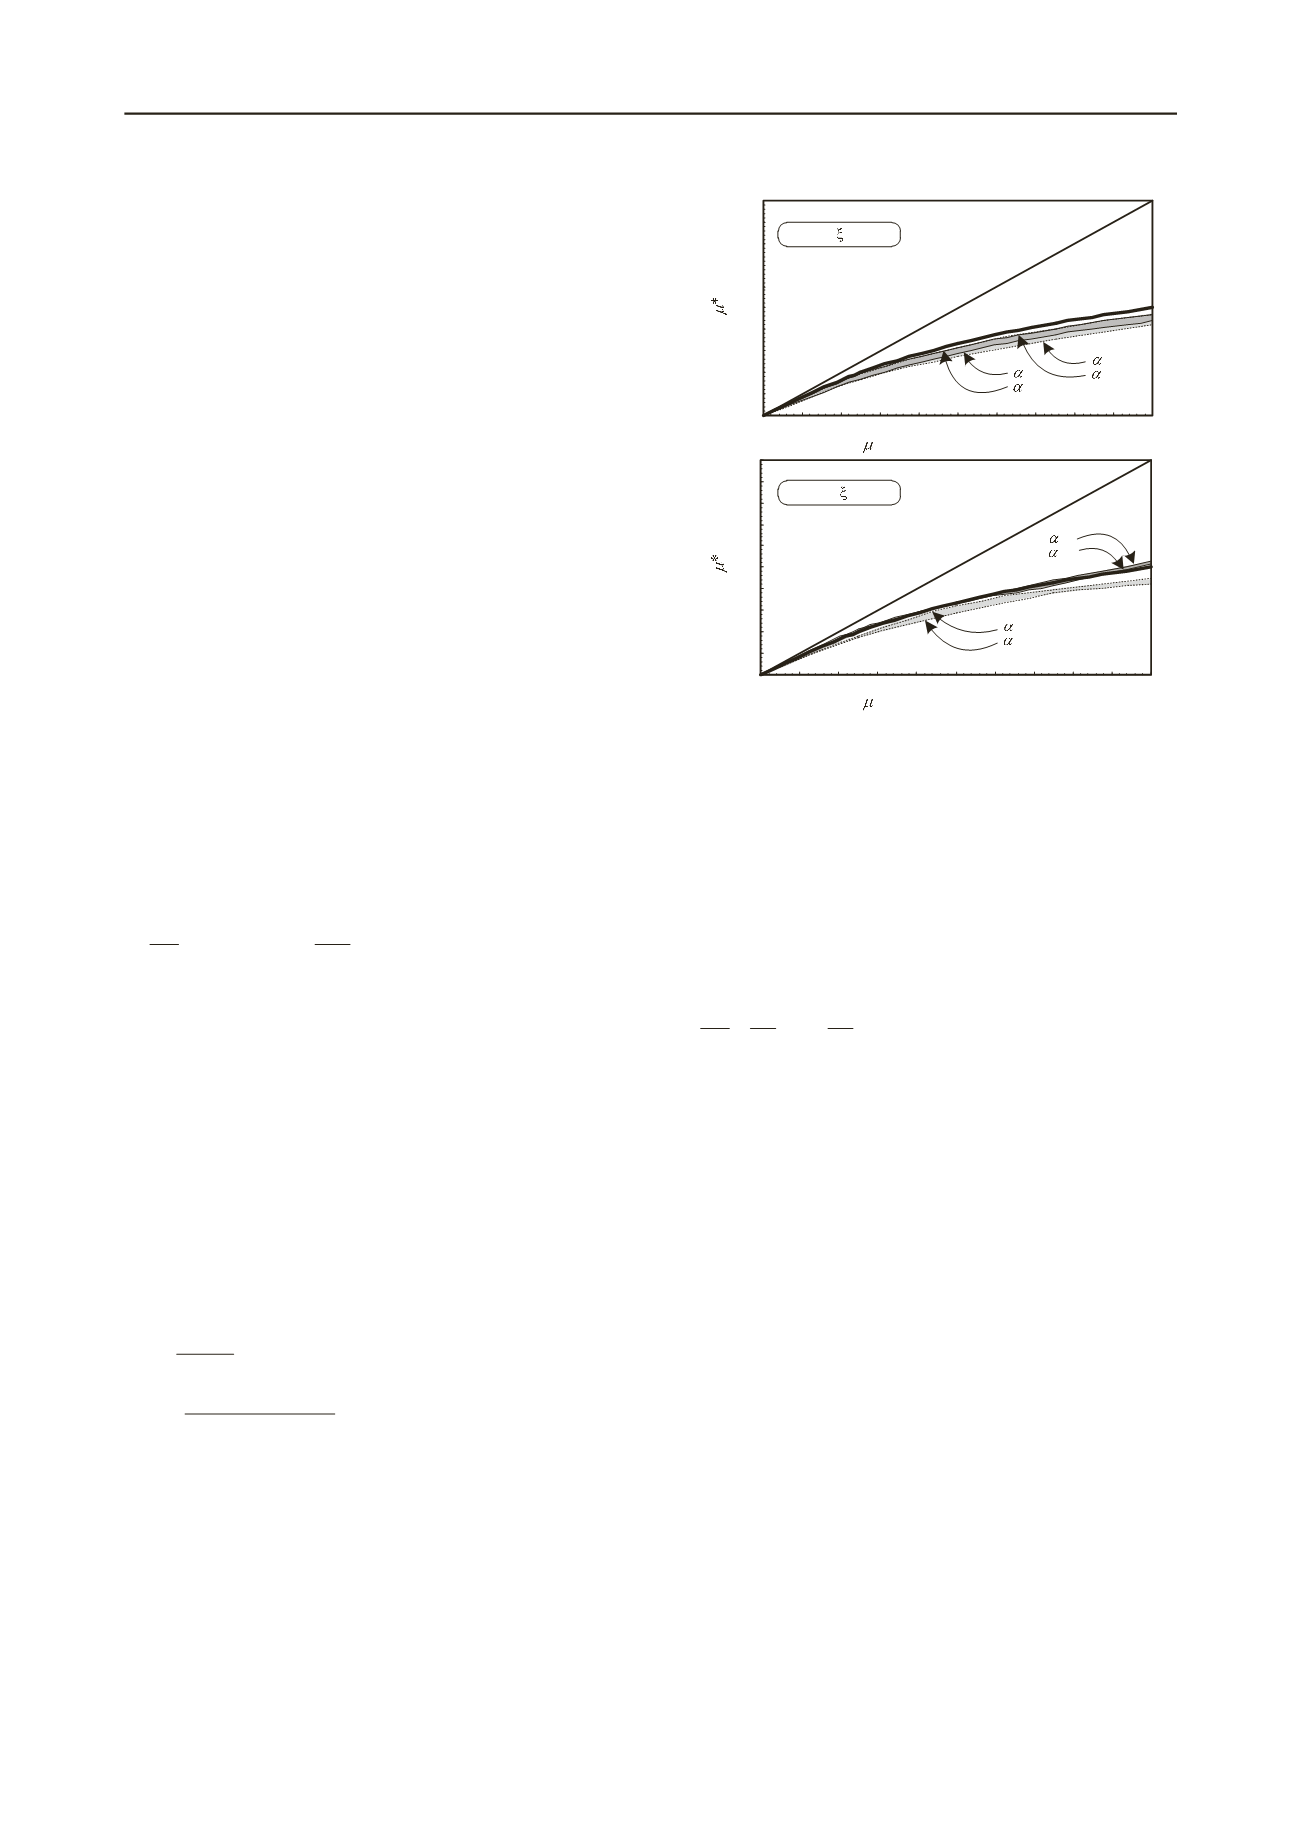
the “upstream weighting” analyses to show that
used in Eq. 2
is not the same parameter which describes the increasing in the
global penetration resistance due to the increase in the
penetration rate,
, as can be shown in Fig. 2.
In addition to the numerical analyses, Pinkert (2012)
developed an algebraic relation between these two parameters,
given by:
2
1
2 1
*
*
*
/ /
/
log
1 /
51
dv dv
qq
(3)
where
q
is the penetration resistance (in stress units),
v
is the
penetration velocity,
d
is the penetrometer diameter, and the
subscripts 1 and 3 denotes two different penetration tests.
=1
=0
Ball
T‐bar
S
T
=20,
95
=10
0
0.02
0.04
0.06
0.08
0.1
0.12
0.14
0.16
0.18
0.2
0
0.05
0.1
0.15
0.2
(used in the strength law)
0
0.02
0.04
0.06
0.08
0.1
0.12
0.14
0.16
0.18
0.2
0
0.05
0.1
0.15
0.2
(used in the strength law)
Eq. 3
1:1
1:1
Eq. 3
=1
=0
=1
=0
Ball
T‐bar
=1
=0
S
T
=2,
95
=50
Figure 2.
versus
for the all range of friction ratio (0
≤
≤ 1), and
for different softening properties, after Pinkert (2012).
3.2. Strain softening effect
The strain softening factor used in this work was developed by
Pinkert (2012), and may be considered a modification of the
“common” strain softening model used
in all previous works
(e.g., Randolph, 2004, Einav and Randolph, 2005, Yafrate and
DeJong, 2007, Klar and Osman, 2008, Klar and Pinkert, 2010,
Zhou and Randolph, 2007&2009), given by:
95
/ 3
0
1 1 1
e
S
S s
s
T
T
u
u
(4)
where
S
T
is the soil sensitivity (=
s
u0
/s
u,residual
),
is the
cumulative engineering strain rate,
is the amount of
required for 95% remolding and
is a constant.
The
parameter does not exist in all previous (aforementioned)
works. Pinkert (2012) showed that a value of 2/3 for
gives a
good fit to the decay function observed in cyclic penetration
tests, under a wide range of soil sensitivities. Note that the
relation between
95
and
N
95
(the number of cycles required to
achieve 95% degradation in the measured resistance, in a cyclic
penetration test) as presented in Einav and Randolph (2005) is
somewhat inconsistent, since
N
95
is associated with degradation
from the first insertion which cannot truly represent an
undisturbed state (since
does not remain zero at the first
insertion). For that reason, Pinkert (2012) suggested a
theoretical parameter,
N
*
95
, which is related to
N
95
, and thus can
be extracted from field test results. The expression for
evaluating
from cyclic field test results is given by:
2/33/2
3/2
95
*
95
95
5.0
2
2
N
N
p
p
(5)
where
N
95
can be correlated with
S
T
following Yafrate et al.
(2009):
27.0
95
6.9
T
S
N
(6)
and
p
is the average magnitude of shear strain undergone by
soil elements passing through the failure mechanism in
individual penetration, which can be estimated based on values
presented in Zhou and Randolph (2009) for both T-bar and ball:
62.2
log1.1
09.3
log 83.0
,
,
T
ball
p
T
Tbar p
S
S
(7)


