791
Technical Committee 103 /
Comité technique 103
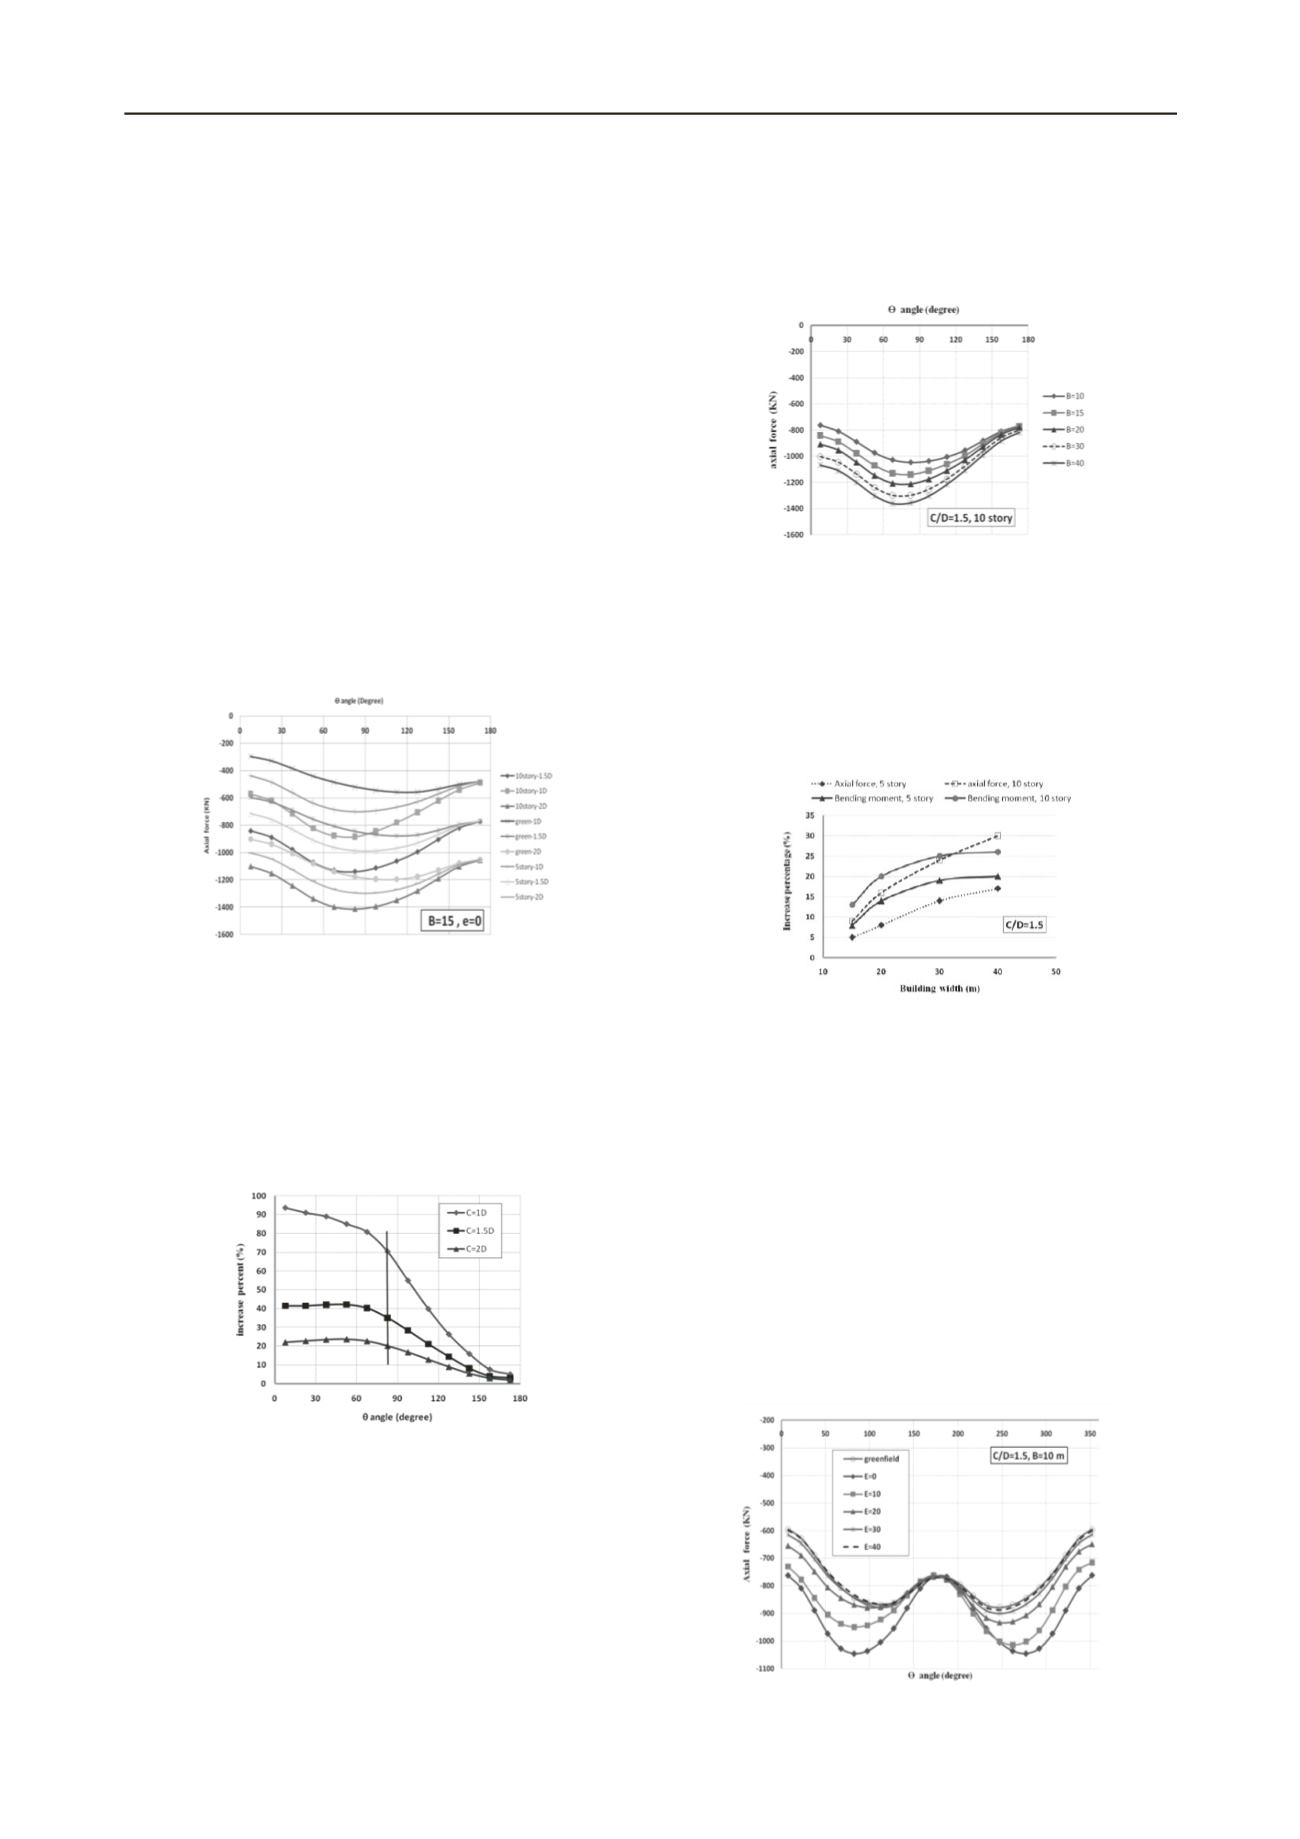
5 RESULTS
Utilizing about 240 two dimensional plane strain finite element
models and conducting parametric studies by ABAQUS
software, the effects of important parameters such as tunnels
depth, building’s weight, width and their locations on the
surface together with soil stratification on the loads acting on
the lining were evaluated. It is to be noted that in models tunnel
lining divided into 24 sections and in presented graphs ө is
angle between center of each section and tunnel crown.
5.1 Tunnel depth (Z0)
As illustrated in figure 1, the existence of the surface building
leads to more forces compared to the green-field condition.
However, the effect of the buildings on the lining forces will be
reduced when the depth of the tunnel increases i.e. for shallow
tunnels, surface buildings will have larger effects on lining
forces. In Figure 2 the increase percentage of axial force due to
10 story building located above center of tunnels in various
depths in respect of Green-field condition presented. The
maximum axial force (induced in side walls and marked with
line in figure 2) increases 70, 35 and 20 percent, respectively.
Figure 1. Axial force for various building load and tunnel depth
[building 15m width above tunnel center]
The effect of tunnel depth in Green-field condition is greater
compared to presence of buildings i.e. as tunnel depth increase,
the axial force of lining compared to C/D=1, increases in both
condition but more increase in Green-field condition could be
seen. Also in Greenfield condition the most increase occurs in
tunnel crown whereas the presence of building has a more effect
in tunnel invert.
Figure 2. Increase percentage of axial force for various tunnel depth
respect to green-field condition [B=15m, 10story, e=0]
Based on obtained results, with increase of tunnel cover
induced bending moment in green-field condition increases. In
the tunnel cover equal to 1.5 and 2 time of tunnel diameter,
maximum bending moment (induced in tunnel invert) increase
20% and 37% respectively compared to 1D cover. When the
building load applied on model, in proportion of building load,
the maximum bending moment in comparsion with green-field,
increases and occurs in tunnel crown but the increase of depth
does not have considerable effects on induced maximum
moment especially in high story buildings. Only negligible
increase in bending moment occurs in lining shoulders as tunnel
becomes depper.
5.2 Building width (B)
In figure 3, sample illustration of building width effect is shown
which reveals that the increase of building width increases axial
force and bending moment in tunnel lining.
Figure 3. Induced axial force for various building widths
Figure 4, presents the increase percentage of internal forces
for various building width values respect to B=10m for different
loads. As shown in the figure the building width has a more
effect on axial forces compared to bending moments .With
increase of building width, its effect on bending moment
gradually decreases. Also it could be seen that with decrease of
building load the effect of building width on lining loads
reduces.
Figure 4. Increase percentage of structural forces respect to B=10m for
various building loads
5.3 Location of the buildings on surface
As described in table 4, different locations of building were
considered. In figure 5, a sample illustration of this parameter
effect is shown for buildings with 10 m width and 10 stories on
lining axial force of tunnel located at depth of 18.4 m. As
shown, as a general rule with increase of building distance from
tunnel centerline the effect of building on lining forces reduce.
This reduction depends on building width and depth of tunnel.
For shallow tunnels and building with small width the effect of
building load vanishes in smaller distance .For example as
shown in figure 10 in the case of C/D=1.5 and B=10m , in
distance of E=30m the effect of building existence is
inconsiderable and the induced axial forces graph is
approximately the same as green-field condition.
Figure 5. Assessment of Building distance to tunnel center line, 10story
Building, B=10 m, Z0=18.4 m


