794
Proceedings of the 18
th
International Conference on Soil Mechanics and Geotechnical Engineering, Paris 2013
Table 1. Properties of the backfill/foundation soil and wall
aterial
m
(
°
)
φ(
°
)
ν
E
(MPa)
γ
(kN/m
3
)
0
32
0.3
115
14.4
Soil
-
-
0.2
30,000
1
24.0
Concrete
wall
1
a very large Young’s modulus (E) is assigned to the wall to model
a stiff concrete retaining wall that does not deform under the applied
backfill soil stresses.
Tangential and normal interactions at backfill-wall, and
backfill-subsoil interfaces are taken into account using surface-
to-surface contact interaction with surface-to-surface
discretization method to enforce an overall contact condition
over regions nearby slave nodes rather than only at individual
slave nodes. A finite-sliding formulation is used at these
interfaces, which allows any arbitrary motion of the surfaces
including separation, sliding and rotation of the surfaces. A hard
contact model is used to define the normal contact pressure-
overclosure relationship between the wall (master) and the
backfill (slave). Tangential interaction between the wall and the
backfill is defined using the static-kinetic exponential decay
function. A geostatic stress field procedure, in which gravity
loads are applied, is used as the first step of the analysis to
verify that the initial geostatic stress field is in equilibrium with
applied loads and boundary conditions. The analysis is followed
by a number of static analysis stages to reach an active state.
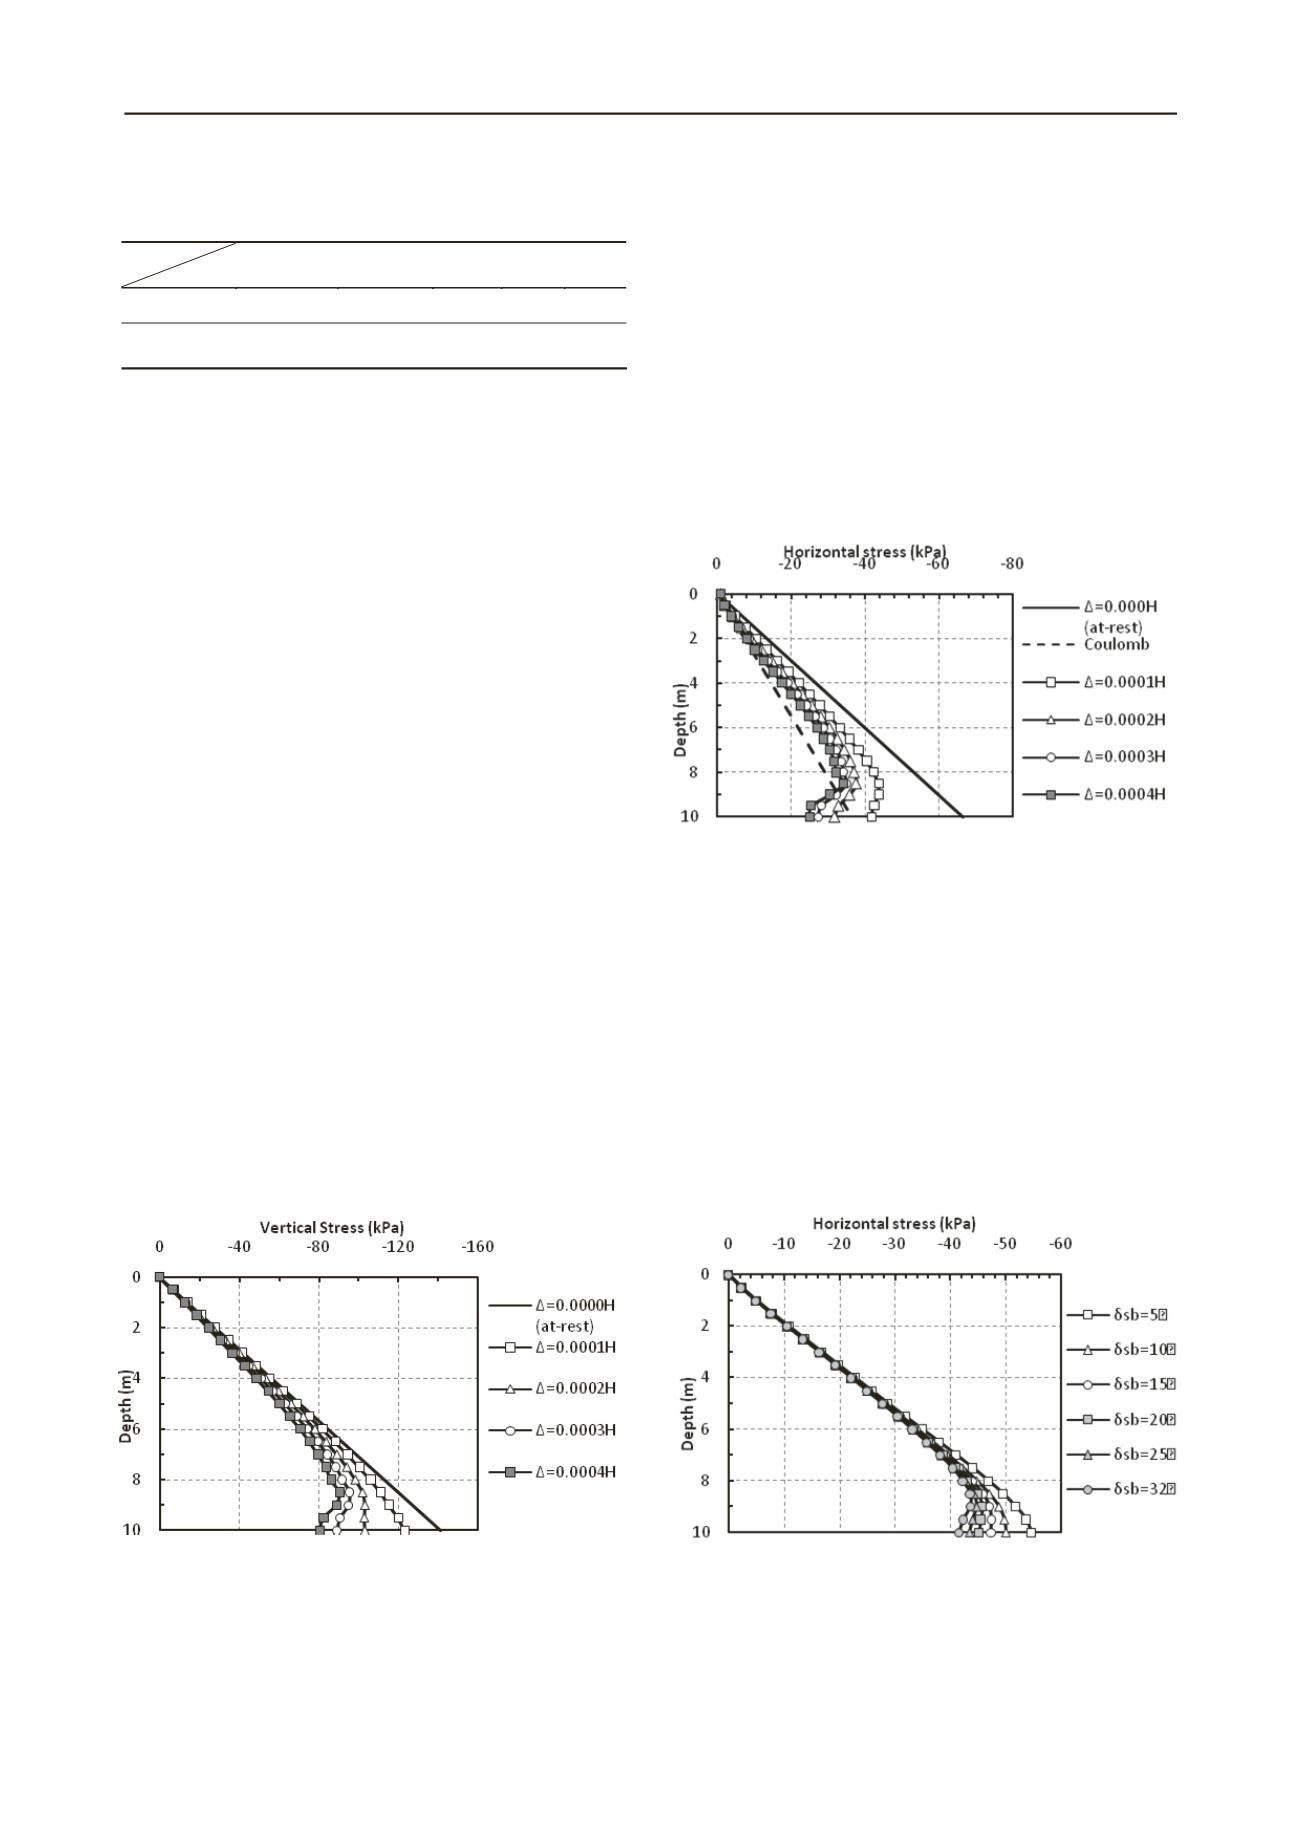
Figure 1: Vertical stress distributions behind the wall for different
amounts of wall displacement (
)
Figure 3: Lateral stress distributions for models with
ws
= 15
o
,
wb
= 20
o
, and with different magnitudes of
sb
Figure 2: Horizontal stress distributions at different wall
displacements as well as that from Coulomb’s method for a wall with
sb
= 32
o
ws
= 15
o
and
wb
= 20
o
3 NUMERICAL RESULTS.
The vertical stress distributions behind the wall at an at-rest
condition (
Δ
= 0.000H) and at different wall movements (
Δ
) are
presented in Figure 1. According to this figure, vertical stress
distribution becomes non-linear and decreases with wall depth
(from the linear stress distribution) and increasing wall
displacement. We anticipate that this non-linearity is produced
by the arching of the backfill soil (within the failure wedge)
between the wall and the backfill outside of the failure wedge.
Arching is developed by the relative displacement at the
interface of the backfill failure wedge and the backfill outside of
the failure wedge. Without any wall movement, there is no
relative displacement and therefore no arching or vertical stress
reduction. As demonstrated later, backfill arching significantly
affects lateral stress distribution on the wall.
Figure 2 presents the horizontal stress distributions at an at-
rest condition and at different wall movements (
Δ
) as well as
that from the Coulomb’s theory. These are calculated for a
model wall with a wall-backfill interface friction angle (δ
wb
) of
20
o
, wall-subsoil interface friction angle (δ
ws
) of 15
o
, and
backfill-subsoil interface friction angle (δ
sb
) of 32
o
. The finite
element pressure distribution diagram for
Δ
= 0.000H matches
the at-rest stress diagram with a horizontal stress coefficient of
0.47 (based on K
o
= 1 – sin 32
o
from Jaky 1944). The finite
element results indicate that the horizontal stress distribution
behind a wall becomes non-linear with wall movement. As
illustrated in Figure 1, with increasing wall displacement,
backfill soil arching also increases and the total lateral trust
(area of the horizontal stress distribution diagram) decreases.
Furthermore, although the horizontal stress distribution
diagrams almost converge for
Δ
≥ 0.0003H, they are very
different from the horizontal stress distribution diagram
produced by Coulomb’s method as this method does not take
into account the effect of backfill soil arching. Despite this
limitation, the total horizontal thrust from Coulomb’s method is
close to that obtained from the finite element analysis.
In Figure 3, lateral stress distribution for models with
different δ
sb
values are presented at a wall movement of Δ =
0.0001H. The results show that the influence of arching
increases by increasing δ
sb
. This is produced by the backfill-
subsoil interaction. At δ
sb
= 5
o
there is very little resistance from
the subsoil and thus the backfill outside of the failure wedge
follows the movement of the failure wedge, thus reducing soil
arching. With increasing δ
sb
the backfill is restrained from
horizontal movement, the relative displacement between the
backfill failure wedge and the backfill outside of the failure
wedge increases, and thus arching and lateral stress reduction
increase.
Lateral stress reduction by arching is presented in Figures 4,
5 and 6 for different magnitudes of δ
sb
, δ
wb
and δ
sw
respectively
in models with different wall movements. These figures
illustrate that the influence of backfill sand arching on lateral


