803
Technical Committee 103 /
Comité technique 103
ij s
f
G
ij
s ijs
2
(21)
DK p p
(22)
ij
ij
f
pH
ij
d
1
(23)
Updated variables are –
(24)
(19b)
ij
ij
ij
p s
ij
d
prev
ij
ij
(25)
4 VISCO-PLASTIC FORMULATION
The loading rate effects due to material viscosity on the
stress-strain behavior of sand (not due to delayed dissipation of
excess pore water) are often very important in geotechnical
engineering practice. A number of researchers (Tatsuoka et al.
2002; Tatsuoka, 2004) reported significant loading rate effects
observed in laboratory stress-strain tests on sand under drained
conditions; i.e., effects of strain rate and its change on the
stress-strain relation, creep deformation and stress-relaxation
during otherwise monotonic loading (ML) at a constant strain
rate.
Within the framework of the general non-linear three-
component model (Fig. 1), Di Benedetto et al. (2002) and
Tatsuoka et al. (2002) proposed a set of stress-strain models to
simulate the effects of material viscosity on the stress-strain
behaviour of geomaterial (i.e., clay, sand, gravel and
sedimentary softrock). They showed that the viscous property of
clean sand (i.e., uniform sand) is different from that of clay in
that the viscous effect decays with an increase in the irreversible
strain and proposed a specific model to describe the above (i.e.,
the TESRA model explained below).
In this paper, it is shown that this model can be smoothly
implemented in a FE code (Siddiquee
et al
., 1996, Siddiquee
et
al.,
2006). Then, the shear stress – shear (or axial) strain
relations obtained from typical drained plane strain compression
(PSC) tests performed at fixed confining pressure on clean
sands (i.e., Toyoura and Hostun sands), reported by Di
Benedetto et al. (2002) and Tatsuoka et al. (2002), that were
simulated by the FE code embedded with the TESRA
Temporary Effect of Strain Rate and Acceleration) model are
reported.
σ
EP2
EP1
V
( , ...)
f
ir
( ,
,...)
v ir
ir
( )
e
e
E
1
ir
Figure 1 General non-linear non-linear three-component
model
Although Di Benedetto et al. (2002) and Tatsuoka et al.
(2002) showed at least three different functional forms of the
viscous component,
v
, were proposed. In this paper, the
simplest form (“New Isotach”) was adopted to describe the
loading rate effects of clay-like materials, for which, for
primary ML along a fixed stress path, the current value of
v
is a non-linear function of instantaneous value of
ir
while it is
always proportional to the instantaneous value of
f
as:
,
v ir ir
(
ir
)
f
ir
v
g
(26)
{1
( )}
f
ir
ir
v
g
(27)
where
(
ir g v
)
is the viscosity function, which is always zero
or positive and given as follows for any strain (
ir
) or stress
(
f
) history (with or without cyclic loading):
( )
[1 exp{1 (
1) }] (
ir
ir
m
v
ir
g
r
0)
(28)
where
ir
is the absolute value of
ir
; and
,
r
ir
and
m
are positive material constants. According to this model, as far
as ML continues along a fixed stress path, the viscous stress
component,
v
, is a unique function of instantaneous values of
ir
and
ir
, independent of previous loading history. The
term “new” of the model name comes from that, with the
original isotach model (Suklje, 1966), the stress
(therefore
v
) is a function of instantaneous strain rate,
/
t
,
not
ir
, while, with the new isotach model,
v
is a function
of
ir
. This difference results into significant variations in the
model behaviour, in particular during stress relaxation with
=
0 and immediately after a step change in
during otherwise
ML at a constant
.
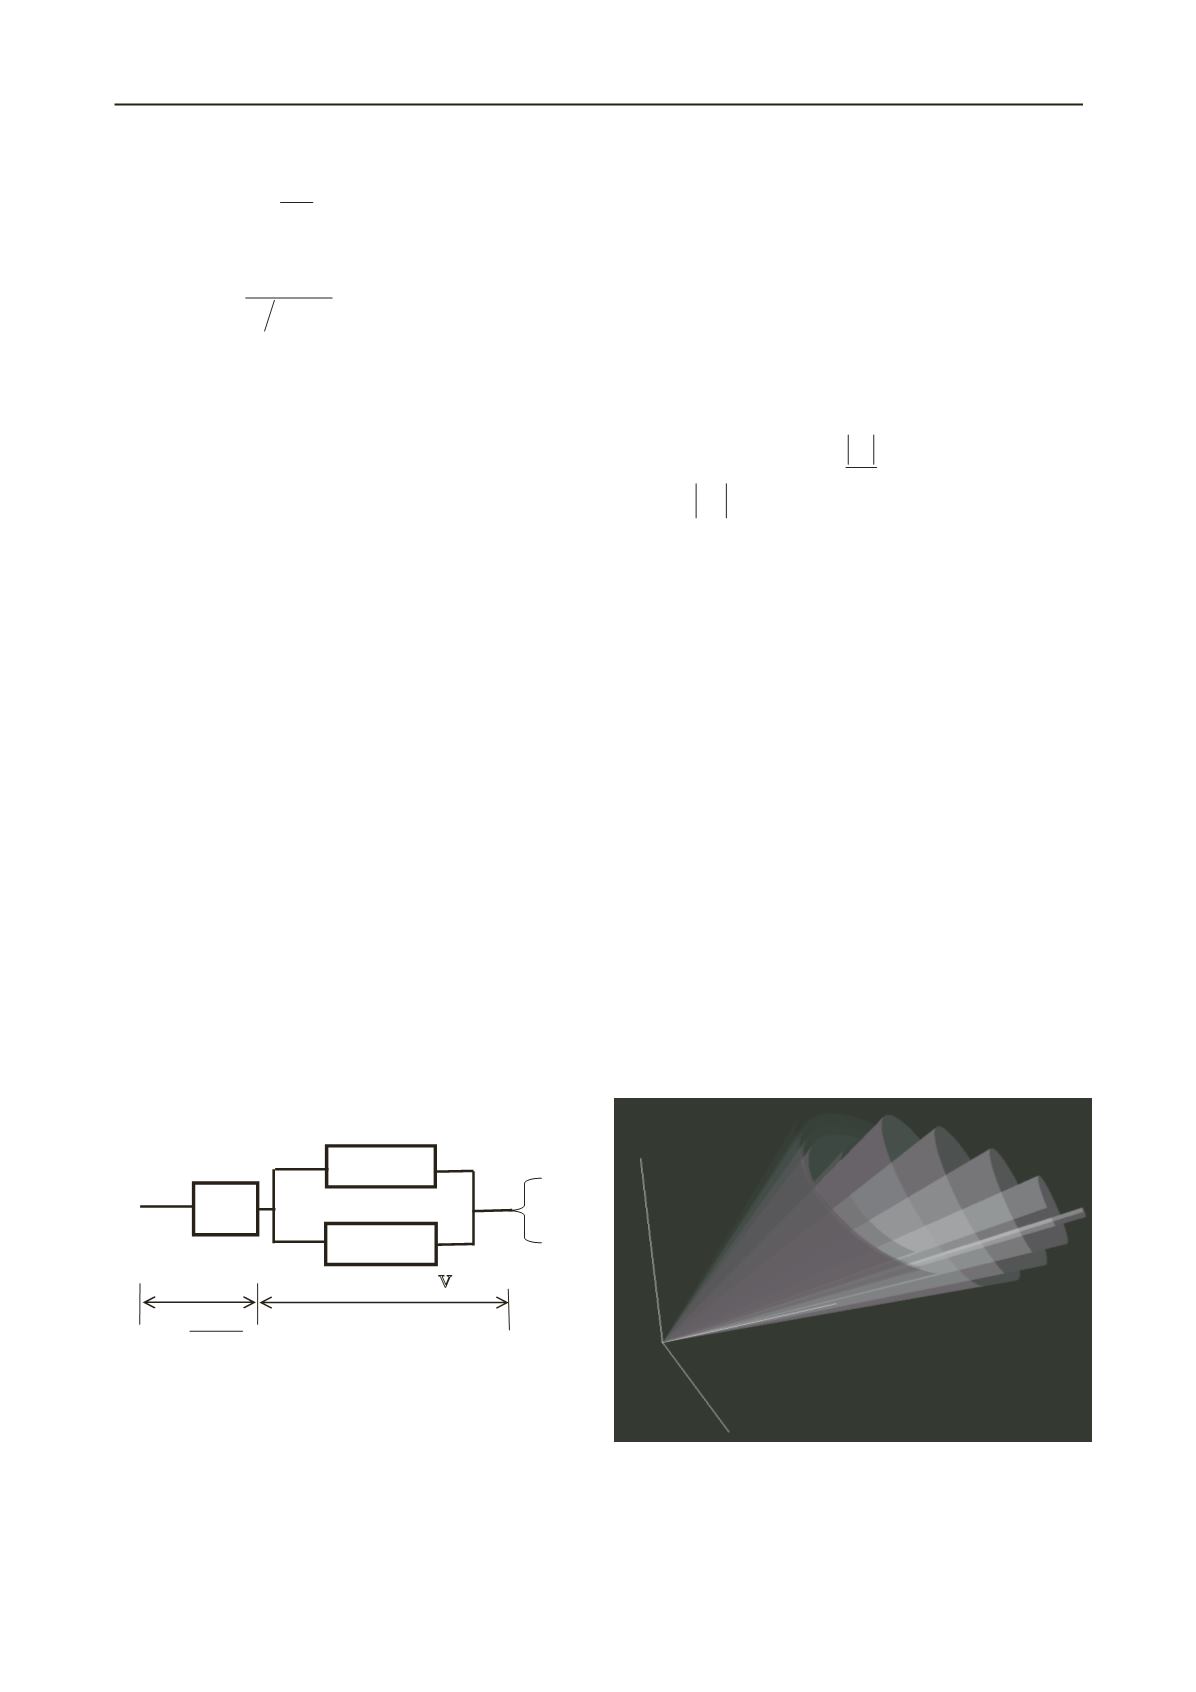
5 IMPLEMENTATION
The model is implemented in one-element FEM with Plane
strain idealization (Siddiquee
et al.,
1999, 2001a, 2001b). The
material data for the initial configuration of the concentric cones
of Drager-Prager yield surfaces (Figure 2) are adopted from the
research work done by Prevost (1985). The viscous property
was set arbitrarily to show the capability of this model by
setting the values of the constants of Eq. (28). Here in this
paper,
=05 and m=0.5 were adopted. The reference value of
loading rate,
r
ir
=1.0e-
8
is set for the analysis. In this paper,
ij
is used instead of
f
in eq. (28) as the model is driven by
the movement of
ij
.
igure 2. Visualization of concentric cones of D ager-Prager
su
F
r
rfaces in Open-GL window.


