 
          810
        
        
          Proceedings of the 18
        
        
          th
        
        
          International Conference on Soil Mechanics and Geotechnical Engineering, Paris 2013
        
        
          The unique shape of backbone curve is used for isotropic
        
        
          compression, while the shape of the shearing backbone curve
        
        
          depends on the


            ‘state of sand’.


          The third unit of the model is the set of input parameters that
        
        
          consists of: material parameters (characteristic for each type of
        
        
          sand), parameters of initial conditions (initial void ratio


            e


          0
        
        
          , over
        
        
          consolidation ratio


            OCR


          and


            K


          0
        
        
          NC
        
        
          coefficient for primary
        
        
          consolidation) and parameters of Iwan system (set of limit
        
        
          displacements for shearing and compression


            u


          i
        
        
          y
        
        
          ).
        
        
          Detailed description of the 1D Iwan system can be found in
        
        
          Iwan (1976) and Segelmen and Star (2008), and description of
        
        
          the generalized 3D Iwan sand model in Sokolić (2010). The
        
        
          model is developed within the critical state concept (Muir
        
        
          Wood, 1990). It accounts for following characteristics of real
        
        
          sand behavior:
        
        
          -
        
        
          unique critical state line;
        
        
          -
        
        
          single Mohr-Coulomb (MC) strength parameter for
        
        
          critical state (angle of internal friction for critical state);
        
        
          -
        
        
          increase of peak strength for dense sand at low stress level
        
        
          -
        
        
          MC failure criteria for general 3D stress space;
        
        
          -
        
        
          high stiffness at small strains;
        
        
          -
        
        
          stiffness reduction due to shearing;
        
        
          -
        
        
          stress dependent dilatancy accounting for phase
        
        
          transformation line concept;
        
        
          -
        
        
          limit compression line concept for isotropic compression
        
        
          -
        
        
          development of hysteresis for unloading and reloading
        
        
          according to Massing rule
        
        
          3
        
        
          SOIL PROPERIES AND MODEL PARAMETERS
        
        
          The soil profile at the site is characteristic for the geology of the
        
        
          central area of Berlin that consists of saturated deposits of
        
        
          quaternary age, reflecting three different glacial periods.
        
        
          Typical profile at the site includes 3-4 m of fill, overlaying three
        
        
          primary sandy till units: (1) S0, upper Holocene sand,
        
        
          approximately 6 m with lower 1-m-thick organic soil unit; (2)
        
        
          S1 glacial sands from the late Pleistocene period that are
        
        
          typically 10 m thick; and (3) S2 glacial sand from the early
        
        
          Pleistocene that are encountered approximately 22 m below the
        
        
          ground surface. The local groundwater table is located 2 m
        
        
          below the ground surface.
        
        
          Berlin sand is poorly graded, fine-medium sand with rounded
        
        
          particles, which are associated with fluvio-glacial deposition.
        
        
          Mineral composition is mainly Quartz and Feldspar. The basic
        
        
          physical properties of Berlin sand are:


            e


          min
        
        
          = 0.39,


            e


          max
        
        
          = 0.59,


            G


          s
        
        
          = 2.65,


            d


          50
        
        
          = 0.38,


            C


          u
        
        
          = 3.0;


            C


          z
        
        
          = 1.2. When compared with
        
        
          other natural sands of similar particle size, shape and grading, it
        
        
          is apparent that Berlin sand exhibits very low formations void
        
        
          ratios and has a small range of formation conditions.
        
        
          Mechanical properties of Berlin sand were tested with detailed
        
        
          laboratory test program including a series of one-dimensional
        
        
          consolidation tests up to high confining stresses, and including
        
        
          drained and undrained triaxial tests for wide range of initial void
        
        
          ration (


            e


          0
        
        
          = 0.43 – 0.60) and consolidation pressure (


            p


          ’ = 100,
        
        
          500 and 800 kPa). The in-situ properties of sand units were
        
        
          tested by heavy dynamic probing test (DPH) and cross-hole
        
        
          measurements of shear velocity propagation. In this study only a
        
        
          data available from published test results were used
        
        
          (Nikolinakou, 2011).
        
        
          3.1


            Input parameters for Iwan sand model


          The priority in defining the input parameters for the Iwan sand
        
        
          model was the following:
        
        
          a)


            To take


          material parameters directly from available
        
        
          published results of laboratory test or


            to accept


          the values
        
        
          adopted for MIT-S1 soil model, based on interpretation of
        
        
          soil investigations (Nikolinakou, 2011)
        
        
          b)


            To derive


          the parameters to best fit the material functions
        
        
          used in MIT-S1 soil model (important for comparison of
        
        
          the numerical simulation results performed by MIT-S1
        
        
          and IWAN sand model)
        
        
          c)


            To calibrate


          the material parameters by performing the
        
        
          triaxial test simulations and compering the results to the
        
        
          available published test results
        
        
          d)


            To adopt


          material parameters from Iwan sand model
        
        
          calibration performed on different types of sand (Sokolić,
        
        
          2010)
        
        
          Material parameters are defined for the set of material functions
        
        
          describing the behavior of real sand observed in triaxial tests
        
        
          (drained or undrained shearing and isotropic compression). All
        
        
          material functions are related to the


            ‘state of sand’


          which is
        
        
          defined by current void ratio


            e


          , current isotropic pressure


            p


          ’,
        
        
          current critical void ratio


            e


          cv
        
        
          (p’) and state index


            I


          s
        
        
          , defined
        
        
          similarly to the standard density index:


          )
        
        
          /
        
        
          min
        
        
          0


            e ee e I


            cv


            cv


            s


          (1)
        
        
          Minimum void ratio parameter is taken directly from laboratory
        
        
          test (


            e


          min
        
        
          = 0.39) while the in-situ profile of initial void ratio is
        
        
          accepted from MIT-S1 numerical model (


            e


          0
        
        
          S0
        
        
          = 0.6,


            e


          0
        
        
          S1
        
        
          = 0.53,


            e


          0
        
        
          S2
        
        
          = 0.4). The initial soil density is interpreted according to the
        
        
          DPH in situ measurements by using empirical correlations.
        
        
          The initial


            K


          0
        
        
          values were not directly measured. In the MIT-S1
        
        
          numerical analysis the values are interpreted according to DPH
        
        
          soil profile and taking in to account the geological deposition of
        
        
          sand layers. The following values are accepted: (


            K


          0
        
        
          S0
        
        
          = 0.5,


            K


          0
        
        
          S1
        
        
          = 1.0,


            K


          0
        
        
          S2
        
        
          = 1.0).
        
        
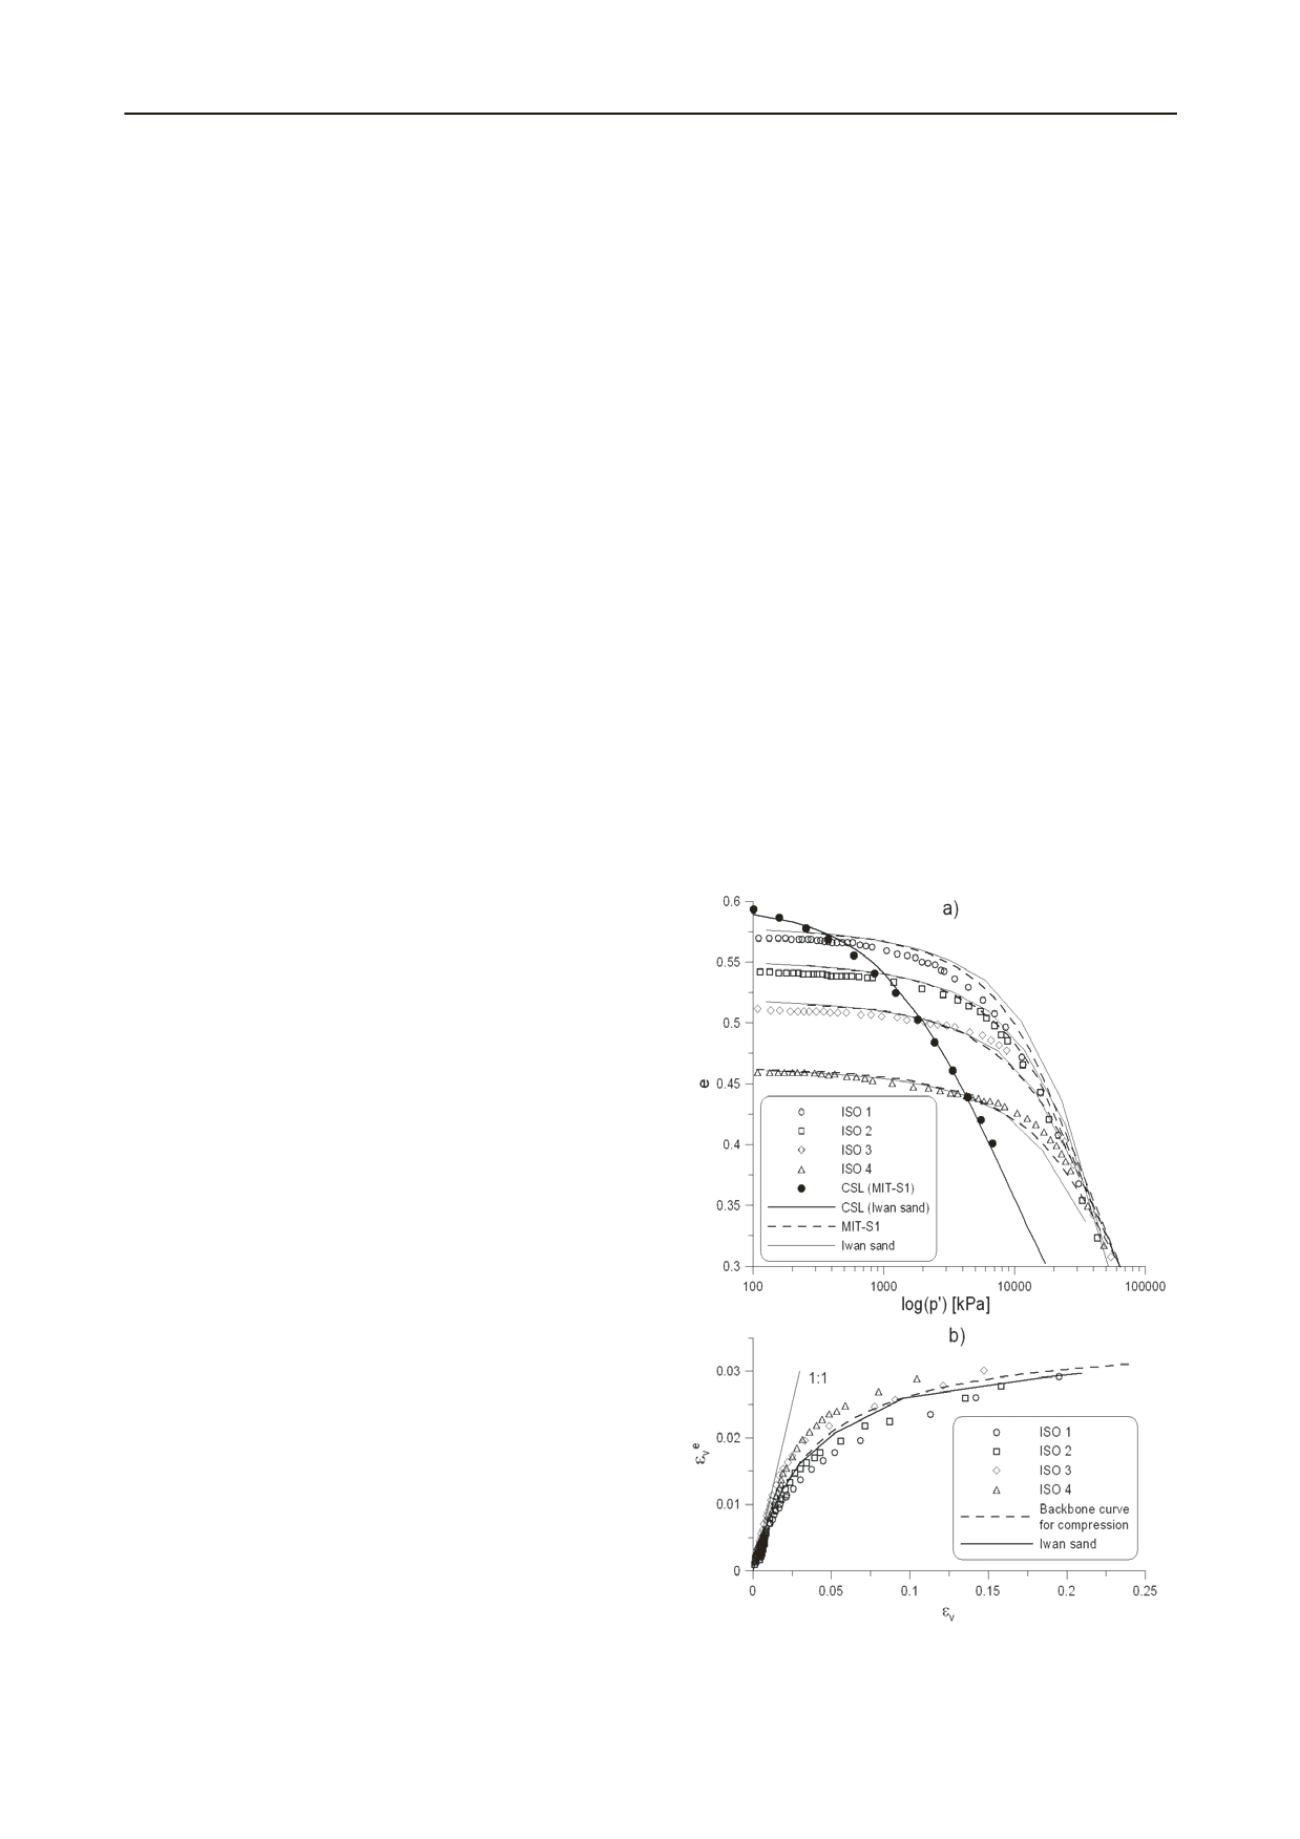
          Figure 2. a) Critical state line (CSL) interpretation and comparison of
        
        
          predicted and ‘measured’ isotropic compression of Berlin sand; b)
        
        
          Backbone curve for isotropic compression of Berlin sand derived from
        
        
          odometer tests