815
Technical Committee 103 /
Comité technique 103
Figure 3 Soil water characteristic curve.
4 NUMERICAL MODEL
The model developed in this work was based on experiments
conducted to investigate the desiccation cracking of compacted
clay fill in the laboratory. As such, the geometry (Figure 4),
material behaviour and initial conditions were based on these
experiments.
The modelled mould consisted of a 190x2 element thick
region located beneath the mesh representing the clay and was
fixed in space. The remaining mesh comprised 190x17
quadrilateral elements, 94 vertically orientated interfaces and 95
horizontal interfaces, the latter forming a single plane between
the base of the clay mesh and the mould. All boundaries of the
sample mesh remained free to shrink/swell in any orientation.
Plane-stress was configured given the finite out-of-plane depth
of the modelled scenario.
Figure 4 Geometry of the model mesh
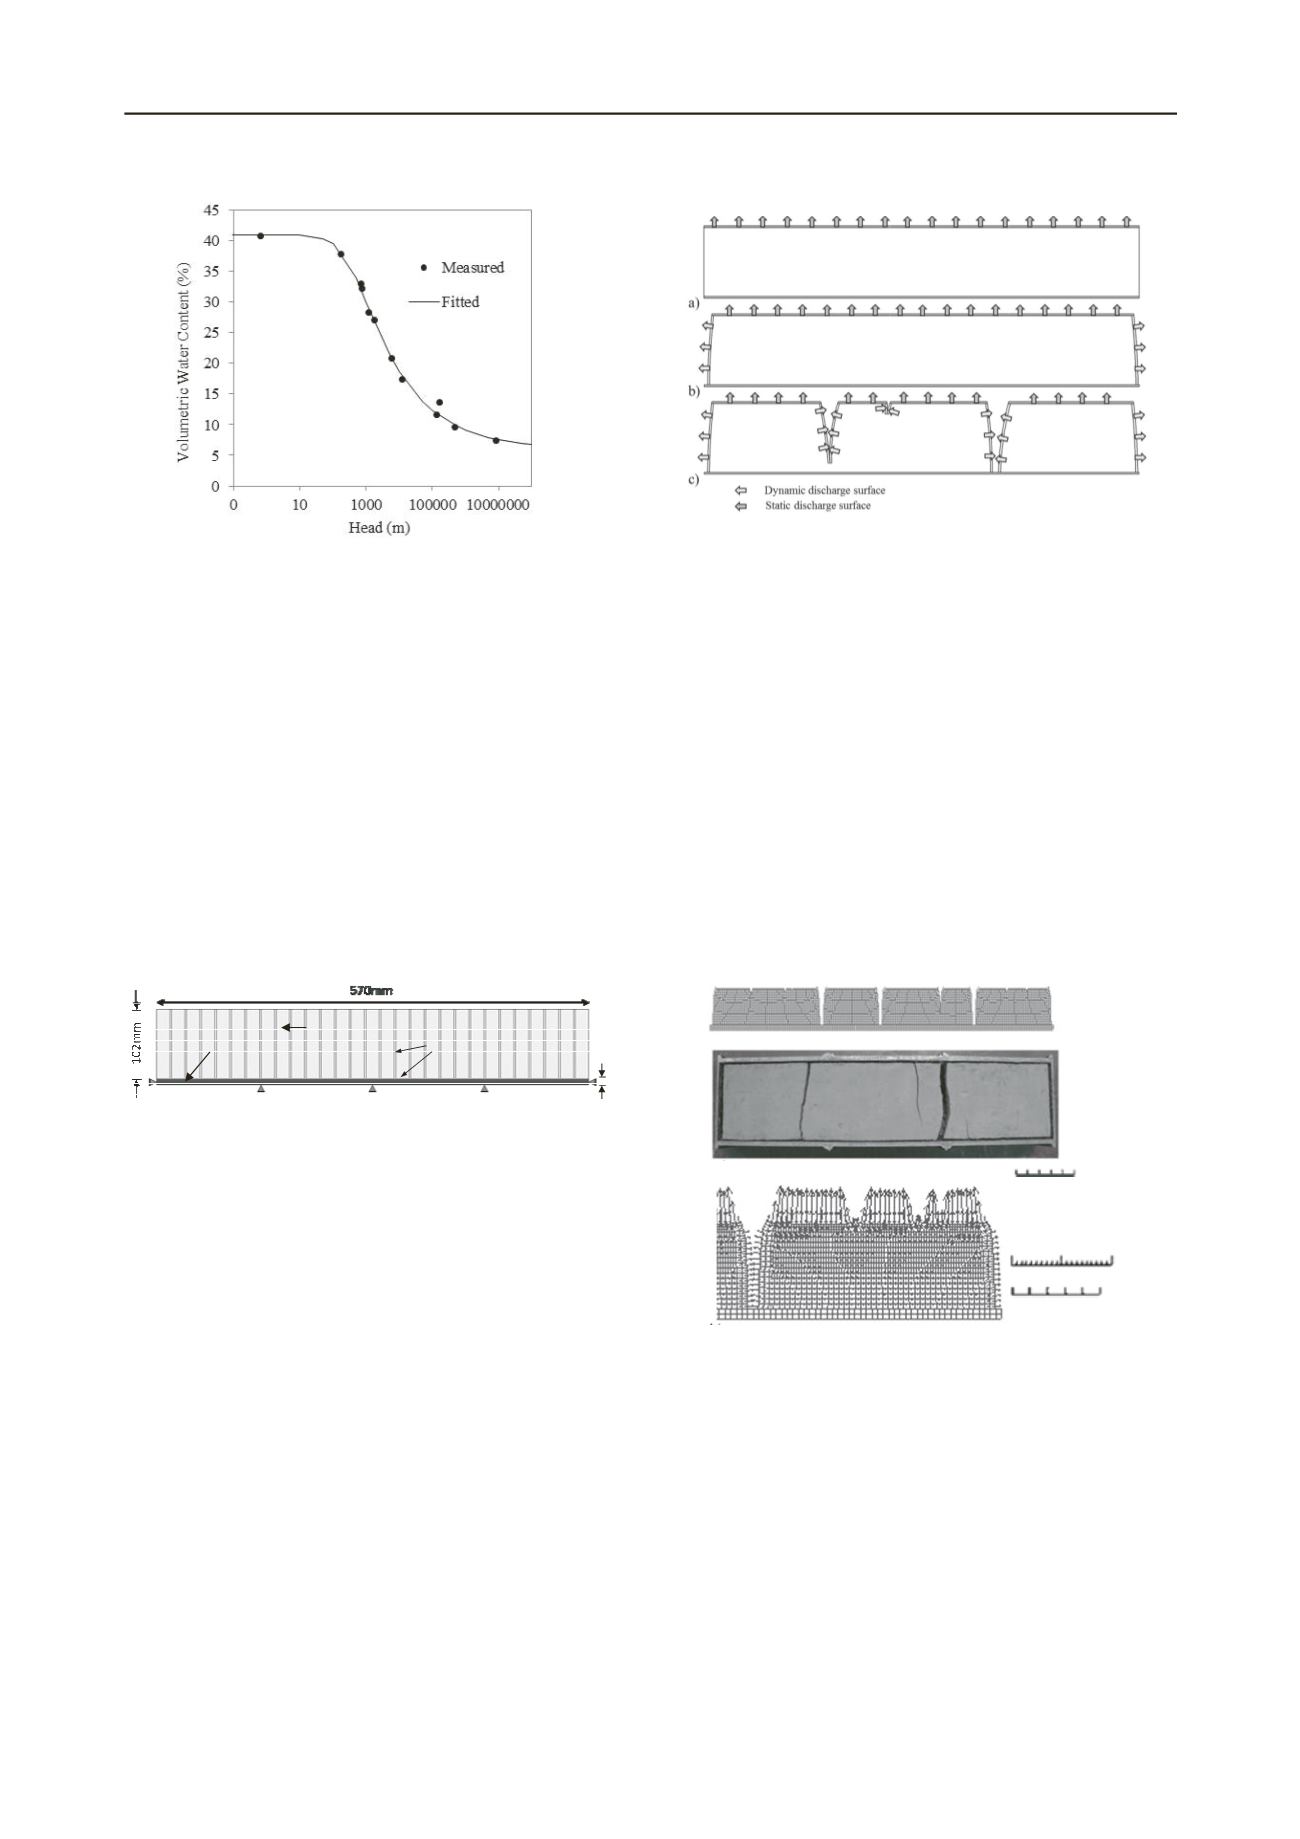
n evaporative drying condition was applied to the exposed,
up
e
wa
a drying rate to be applied to the surface,
thi
ace b)
5 RESULTS
An example of the output geometry from a typical
sim
.
A
per surface of the clay. The drying flux was numerically
simulated by application of a discharge boundary condition
statically located at the upper surface of the model mesh (5a).
During the early stages of experimental drying, shrinkag
s observed as both ends of the soil sample, away from the
mould ends resulting in an increase in the exposed surface area
of the sample. Therefore, in addition to simulated discharge
from the upper surface of the sample mesh, the transient
behaviour of the exposed end surfaces was accommodated.
Furthermore, the evaporative surface area increases upon the
onset of cracking and this is also included. At every simulated
hour of drying, each interface is assessed for separation (i.e.
crack opening). When separation is identified, the exposed
‘crack wall’ is subjected to the dynamic discharge condition. An
example evolution of the drying boundary geometry is
illustrated in Figure 5.
The model requires
s was determined from laboratory experiments where mass
loss is considered to be solely that of water.
Figure 5 Illustration of the drying boundaries a) Initial upper surf
Upper surface plus exposed sample ends and c) Upper surface, exposed
ends plus crack walls.
ulation is provided in Figure 6a alongside a representative
laboratory experiment. It can be seen that shrinkage of the
modelled clay has taken place, represented by the difference in
total length between the mesh simulating the clay and that of the
fixed mould. Towards the outer boundaries of the clay mesh, the
edge is seen to curve from the vertical. This realistic behaviour
is captured by the ability of the model to generate the non-linear
negative pore pressure gradient through the depth of the mesh.
By applying a drying condition to the outer surface, primarily
the upper boundary, this region has been found to develop the
greatest suction magnitudes. Additionally, the overall residual
height of the mesh following drying is found to have reduced
from the pre-drying condition.
Figure 6 a) Model geometry output (side elevation) and an inset
example laboratory experiment (plan elevation) and b) Cracked
geometry with flow vectors.
Flow may be seen in Figure 6b to predominantly act in the
upward direction throughout the medium. In the vicinity of
separated interfaces, flow is shown to occur toward the crack
wall contributing to the overall drying mechanism of the model.
The ability to capture the development of tensile stress
throughout the medium is vital for the simulation of crack
initiation and growth conditions. A representative contour plot
of total horizontal stress is presented in Figure 7. Most clearly
depicted is the generation of greatest tensile stress localisation
about the modelled crack tip. As the propagation of interface
separation takes place it is found that the magnitude of this
Flow vectors
Scaled to Max = 1E‐7
Max Vector = 8.045E‐8
0
0
2E‐7
5E‐2m
0
1E‐1m
a)
b)
Interfaces
2mm
Soil
Mould


