806
Proceedings of the 18
th
International Conference on Soil Mechanics and Geotechnical Engineering, Paris 2013
Proceedings of the 18
th
International Conference on Soil Mechanics and Geotechnical Engineering, Paris 2013
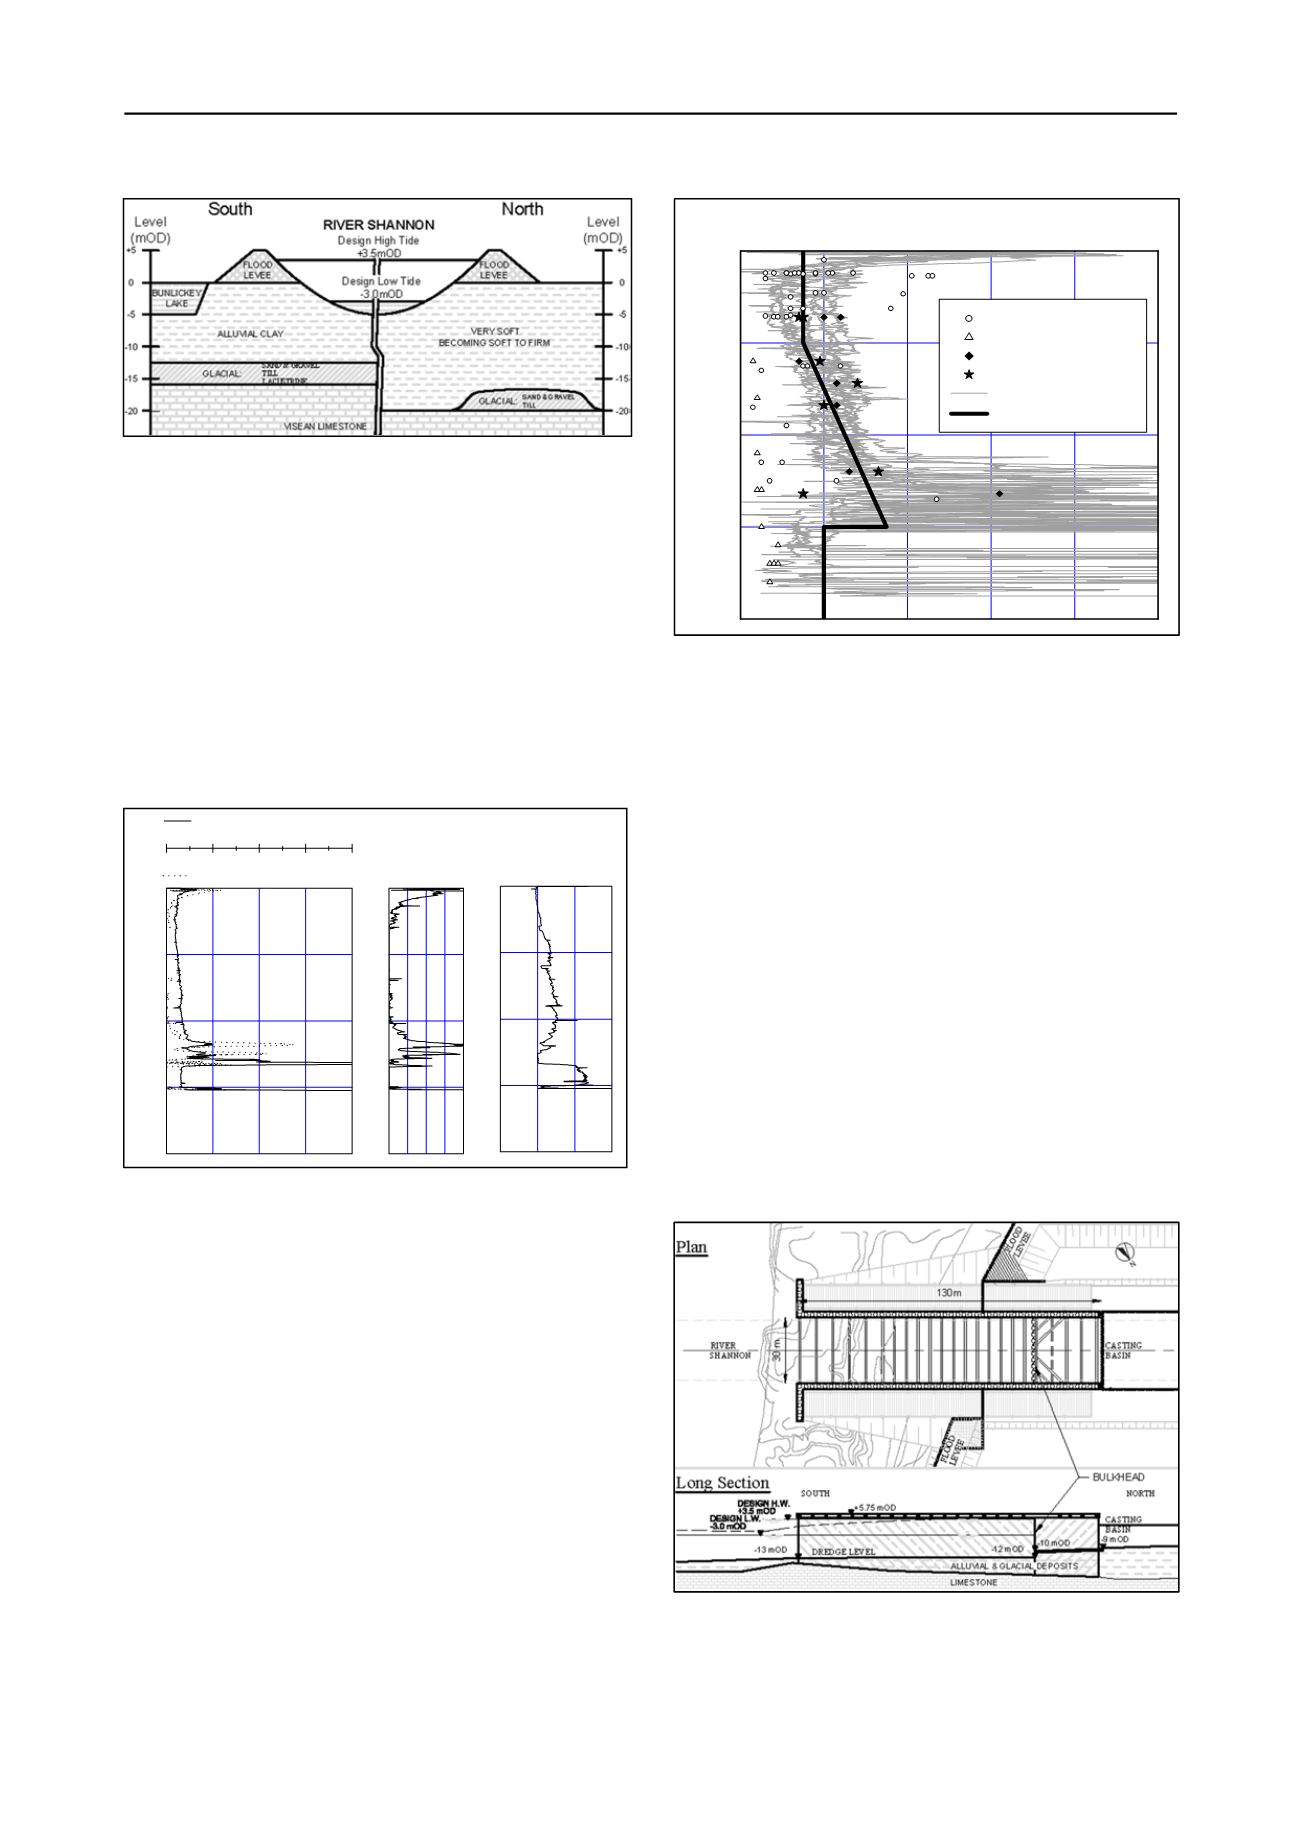
Figure 2. Schematic ground section along line of tunnel
The properties of the alluvial clay dominated the design of
the tunnel. They were investigated primarily using static cone
penetration tests (CPTs). Figure 3 shows a typical CPT profile.
There is a thin crust, below which the strength decreases, then
gradually increases again with depth. Between 11.5 and 13.5 m
the end resistance increases significantly, and this layer is
believed to be a paleo-surface which at some time has dried out.
Below it, the cone resistance decreases substantially. Over
much of the depth of the clay, the sleeve friction is zero. This is
believed to result from the very sensitive nature of the clay,
which liquefies as it is penetrated by the cone, so the friction
sleeve measures no strength. The measured pore pressures were
correspondingly very high.
Figure 3. Typical static cone test profile
Figure 4 shows a composite plot of cone resistance, plotted
as interpreted undrained shear strength, together with the design
profile adopted and results from undrained triaxial tests on
U100 samples and from vane tests carried out in boreholes.
Both the triaxial tests and the vane tests gave much lower values
than the cone tests. It was believed that the very sensitive
nature of the clay led both to sample disturbance and to
disturbance below the base of the borehole. In order to verify
the design profile, high-quality “Mostap” push samples were
taken using the cone equipment, and subjected to
unconsolidated undrained and direct simple shear tests. These
gave values straddling the design profile from the cone tests,
and hence gave additional confidence in its use. Buggy and
Peters (2007) derived a very similar shear strength profile for
the approach roads to the tunnel.
Figure 4. Undrained shear strength results for alluvial clay
It may be noted that the design shear strength profile
corresponds to a value of the ratio s
u
/
σ
v
’ of between 0.30 and
0.35. This is comparatively high for a normally consolidated
clay. Two cone tests were carried out from the top of the flood
levees, where the value of
σ
v
’ would be expected to be 80 to
100 kPa greater, but to have been applied for a comparatively
short period. These gave higher shear strengths, but a lower
value of s
u
/
σ
v
’ of 0.24, consistent with what would be expected
for normally consolidated clay. It is therefore believed that the
high strength ratio of the clay results from some form of aging.
3 DESCRIPTION OF ENABLING WORKS
As briefly described above, the tunnel units were constructed in
an in-line casting basin on the north side of the river. They
were floated out through an open-ended retained excavation
130 m by 30 m (Figure 5). A bulkhead 30 m from the casting
basin end retained the river, and was removed when the casting
basin was flooded. On immersion, the tunnel units were placed
in a trench dredged across the river. The first unit was
connected to a cut and cover section at the southern side of the
river. This was constructed in a second retained excavation,
also 130 m by 30 m, which was essentially a closed-ended box.
Figure 5. Northern float-out section
Retention for both structures was provided by 1420 mm
tubes and pairs of sheet piles. On the north side of the river, the
glacial deposits overlying the limestone were not continuous.
Dowels were therefore drilled into the limestone to provide toe
20
15
10
5
0
0
50
100 150 200
Sleeve Friction f
s
(kPa)
Depth (m)
0
2
4
6
8
Total Cone Resistance, q
t
(MPa)
0 2 4 6 8
Friction Ratio (%)
-1 0 1 2
Pore Pressure Ratio
20
15
10
5
0
0
20
40
60
80
100
UUs: U100 samples
In-situ vanes
UUs: push samples
DSSs: push samples
Cone tests, N
kt
= 17
Design profile
Undrained Shear Strength (kPa)
Depth (m)


