 
          811
        
        
          Technical Committee 103 /


            Comité technique 103


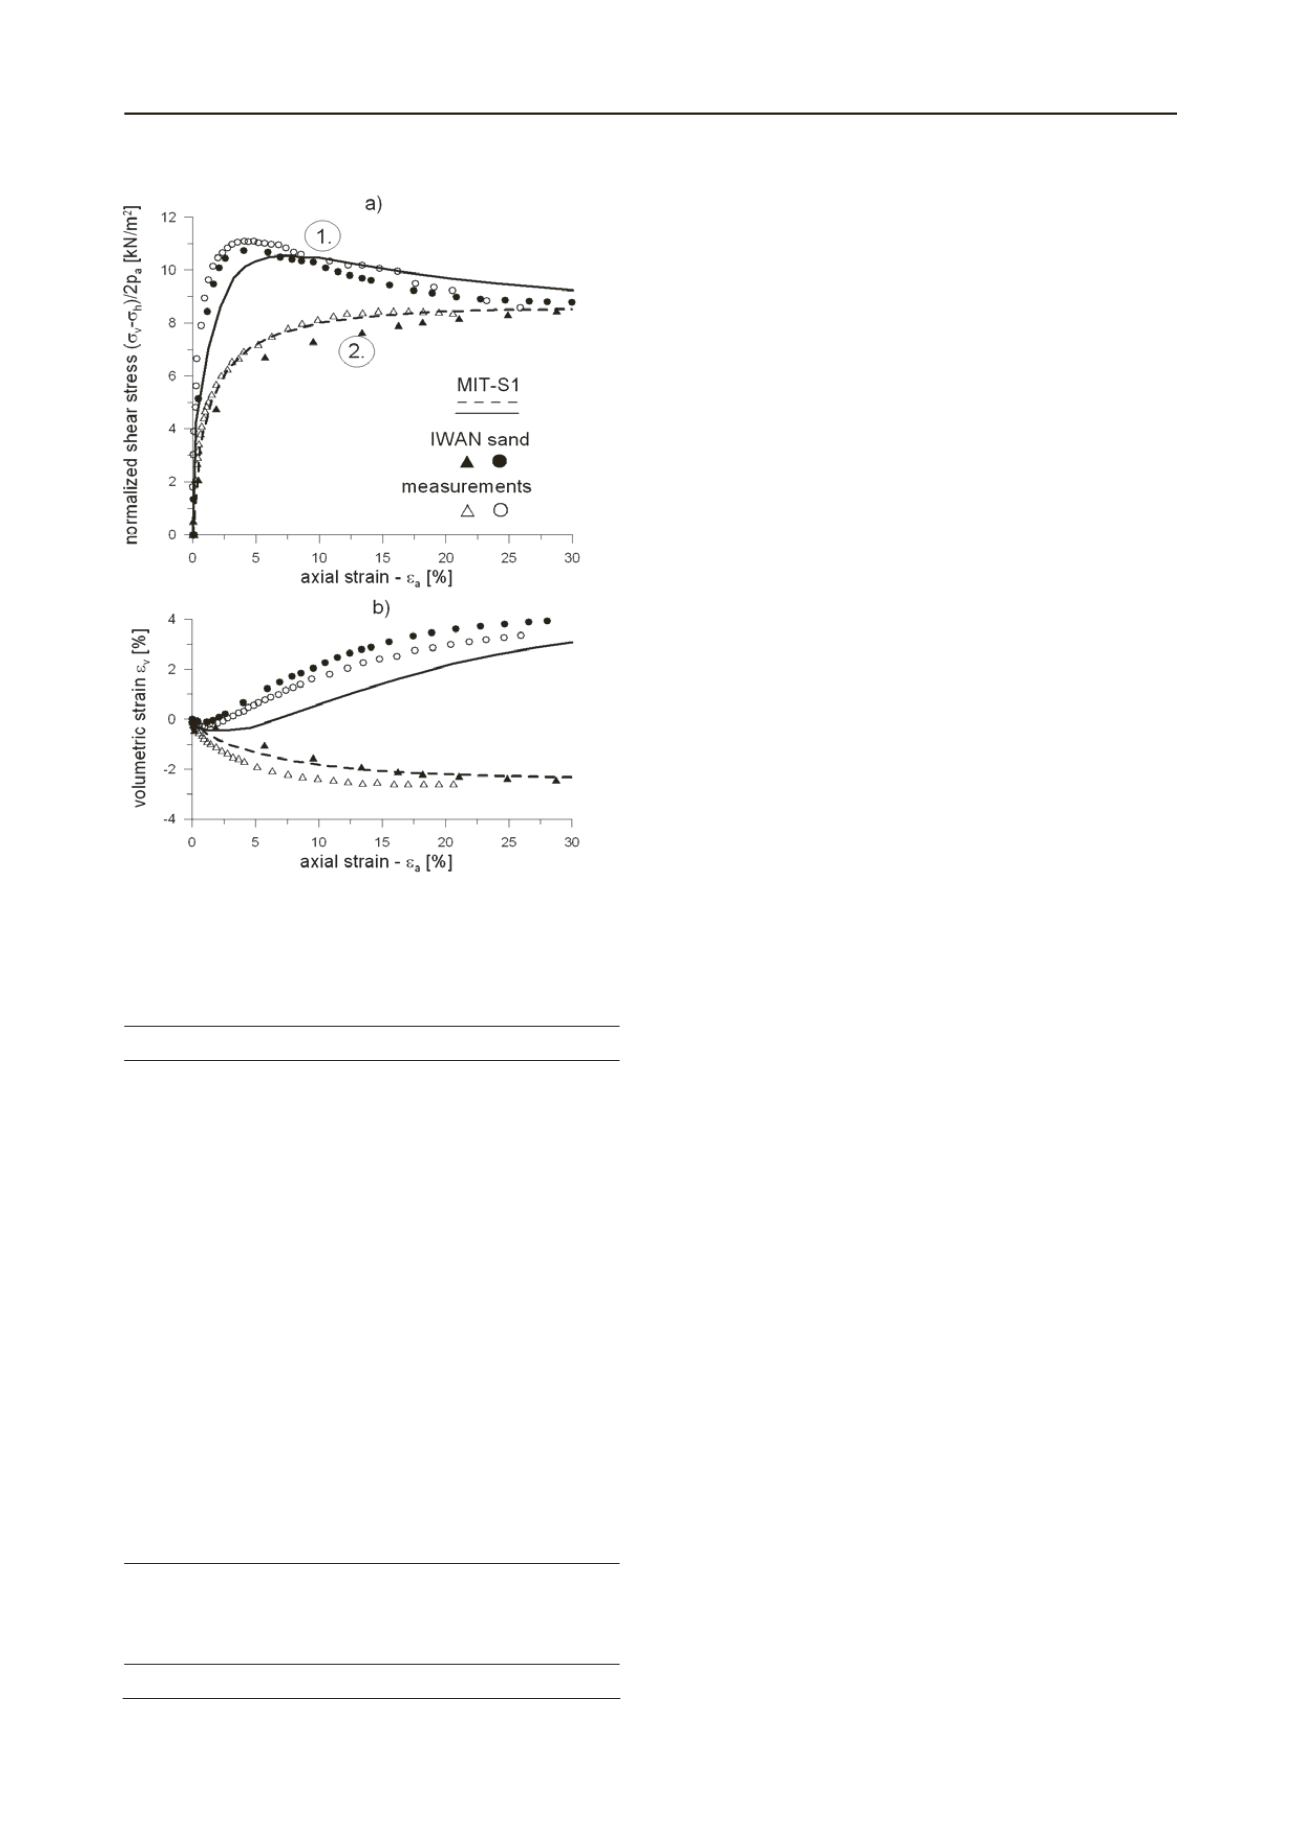
          Figure 3. Comparison of predicted and measured results of CID triaxial
        
        
          test for danse and loose sample of Berlin sand
        
        
          Table 1. Iwan sand model parameters. (
        
        
          a)
        
        
          material parameters for Berlin
        
        
          sand;
        
        
          b)
        
        
          initial state parameters;
        
        
          c)
        
        
          Iwan system parameters;
        
        
          *
        
        
          adopted
        
        
          rom Iwan model calibration – Sokolić, 2010)
        
        
          f
        
        
          Parameter [unit]


            symbol


            value


          a)
        
        
          Minimum void ratio


            e


          min
        
        
          0.389
        
        
          a)
        
        
          Fiction angle for critical state [
        
        
          o
        
        
          ]


            φ


          cv
        
        
          31
        
        
          a)
        
        
          Peak strength parameter


            k


          M
        
        
          1.3
        
        
          a)
        
        
          Initial shear stiffness parameter [kPa]


            A


          67.000
        
        
          a)
        
        
          Power exponent for stiffness


            m


          0.33
        
        
          a)
        
        
          Poisson’s ratio


          0
        
        
          *
        
        
          a)
        
        
          Critical state line


          2.35


            s


          c
        
        
          3544


          0.385
        
        
          a)
        
        
          Shear backbone curve


            b


          0.03
        
        
          *


            a


          1
        
        
          0.16
        
        
          *


            a


          2
        
        
          0.60
        
        
          *
        
        
          a)
        
        
          Dilatancy


            d


          1
        
        
          2.0
        
        
          *


            d


          2
        
        
          -0.5
        
        
          *
        
        
          a)
        
        
          Compression backbone curve


            v


          28
        
        
          b)
        
        
          Initial void ratio


            e


          0
        
        
          0.4 – 0.6
        
        
          b)
        
        
          Over consolidation ratio


            OCR


          1.0
        
        
          b)


            K


          0
        
        
          for normal consolidation


            K


          0
        
        
          NC
        
        
          0.5
        
        
          c)
        
        
          Limit strains (20 elements) [%]


            u


          i
        
        
          y
        
        
          0.01 - 50
        
        
          Critical state line (CSL) is defined by the following expression
        
        
          proposed by Sheng et. al. (2008):


            ref


            c


            cv


            pp s


            e


          /'
        
        
          /


          (2)
        
        
          The parameters are derived to best fit the CSL line adopted for
        
        
          MIT-S1 soil model (


          = 2.35,


            s


          c
        
        
          = 3544,


          = 0.385;


            p


          ref
        
        
          = 100
        
        
          kPa). The value of CSL line for ‘zero’ isotropic pressure defines
        
        
          the material parameter


            e


          cv0
        
        
          = 0.60 (Figure 2.a).
        
        
          Shear strength is defined by following expressions (similar to
        
        
          concept proposed by Jeffries and Been 2006):


            sM cv


            C


            IkMM


          (3)
        
        
          where


            M


          C
        
        
          is the peak strength ratio for drained triaxial test
        
        
          (


            M


          c
        
        
          =


            q


          p
        
        
          /


            p


          p
        
        
          ’;


            q


          p
        
        
          – peak deviator stress;


            p


          p
        
        
          ’ – effective isotropic
        
        
          pressure at peak strength);


            M


          cv
        
        
          is the strength ratio for critical
        
        
          state of sand (


            M


          cv
        
        
          = 6sin(


            φ


          cv
        
        
          )/[3-sin(


            φ


          cv
        
        
          )];


            φ


          cv
        
        
          = 31
        
        
          o
        
        
          – friction
        
        
          angle for critical state taken from results of triaxial tests). Peak
        
        
          strength parameter


            k


          M
        
        
          = 1.3 is calibrated by numerical
        
        
          simulations of CID test and by comparing the results to the
        
        
          available measurements (Figure 3.a).
        
        
          Initial shear stiffness of the sand


            G


          0
        
        
          is defined by following
        
        
          expression (proposed by Pestana and Salvati 2006):


            m


            ref


            pp Ae G


          /'
        
        
          3.1
        
        
          0


          (4)
        
        
          where


            m


          = 0.33 is power index accepted as proposed for
        
        
          MIT-S1 soil model, and


            A


          = 67.000 kPa is initial shear stiffness
        
        
          parameter derived to best fit the initial stiffness profile proposed
        
        
          for MIT-S1 numerical simulation.
        
        
          Backbone curve for isotropic compression is defined by
        
        
          following expression (hyperbola):


            v


            v


            e


            v


            v


          1/
        
        
          (5)
        
        
          where


          v
        
        
          e
        
        
          is elastic component of volumetric strain,


          v
        
        
          is natural
        
        
          volumetric strain and


            v


          = 28 is material parameter for sand
        
        
          compression derived as best fit approximation of isotropic test
        
        
          results (Figure 2.b). The odometer tests performed on Berlin
        
        
          sand are interpreted as isotropic compression tests by using


            K


          0
        
        
          value according to Jaky’s correlation


            K


          0
        
        
          = 1– sin


            φ


          =  0.5.
        
        
          All remaining material parameters are adopted from model
        
        
          calibration preformed on different types of sand (Erksak,
        
        
          Otawa, Ticino, Toyoura, Boštanja, Cambria). Parameters are
        
        
          used for backbone curve of triaxial shearing (double hyperbola
        
        
          function similar to stiffness reduction curve proposed by Fahey
        
        
          and Carter 1993) and stress dependent dilatancy function
        
        
          (integrated function as combination of expressions proposed by
        
        
          Li and Dafalias 2000, and Gutierrez 2003).
        
        
          Input parameters for Iwan system are also adopted from model
        
        
          calibration (number of spring-slider elements


            n


          Iw
        
        
          = 20; limit
        
        
          displacements for shearing and compression for each element
        
        
          spanning evenly the range of strains 0.01% to 50% in
        
        
          logarithmic scale).
        
        
          4
        
        
          NUMERICAL ANALYSIS
        
        
          Numerical analysis of deep excavation are performed within the
        
        
          commercial finite-element program Plaxis 2D (Brinkgrawe,
        
        
          2008). The geometry and boundary conditions of the model are
        
        
          adopted from the numerical analysis performed by the advanced
        
        
          model MIT-S1 (Nikolinakou, 2011). Two wall sections were
        
        
          analyzed (MQ3 and MQ5). Soil profile is modeled by three
        
        
          horizontal soil layers with underground water level 2 m below
        
        
          the surface level.