814
Proceedings of the 18
th
International Conference on Soil Mechanics and Geotechnical Engineering, Paris 2013
The tp-flow option allows the flow of two immiscible fluids
to be modelled whose proportions are representative of soil
saturation. Darcy’s law is then used to define the wetting and
non-wetting fluid flow according to their relative pressures.
Capillary pressure is fundamentally linked to the effective
saturation and is considered in this work using the van
Genuchten approximation (van Genuchten 1980). The relative
permeability of each fluid is considered to be a fraction of the
saturated coefficient of permeability dependent upon the
effective saturation.
Coupled fluid-mechanical modelling was conducted in
which volumetric deformation causes changes in fluid
pressures. Similarly, changes in effective stress result in
volumetric strain, with the pore pressure increment weighted by
the level of saturation (Itasca 2002).
3 MATERIAL PROPERTIES
3.1 Continuum properties
For simplicity, the soil was assumed to behave elastically,
although non-linear behaviour was captured as described below.
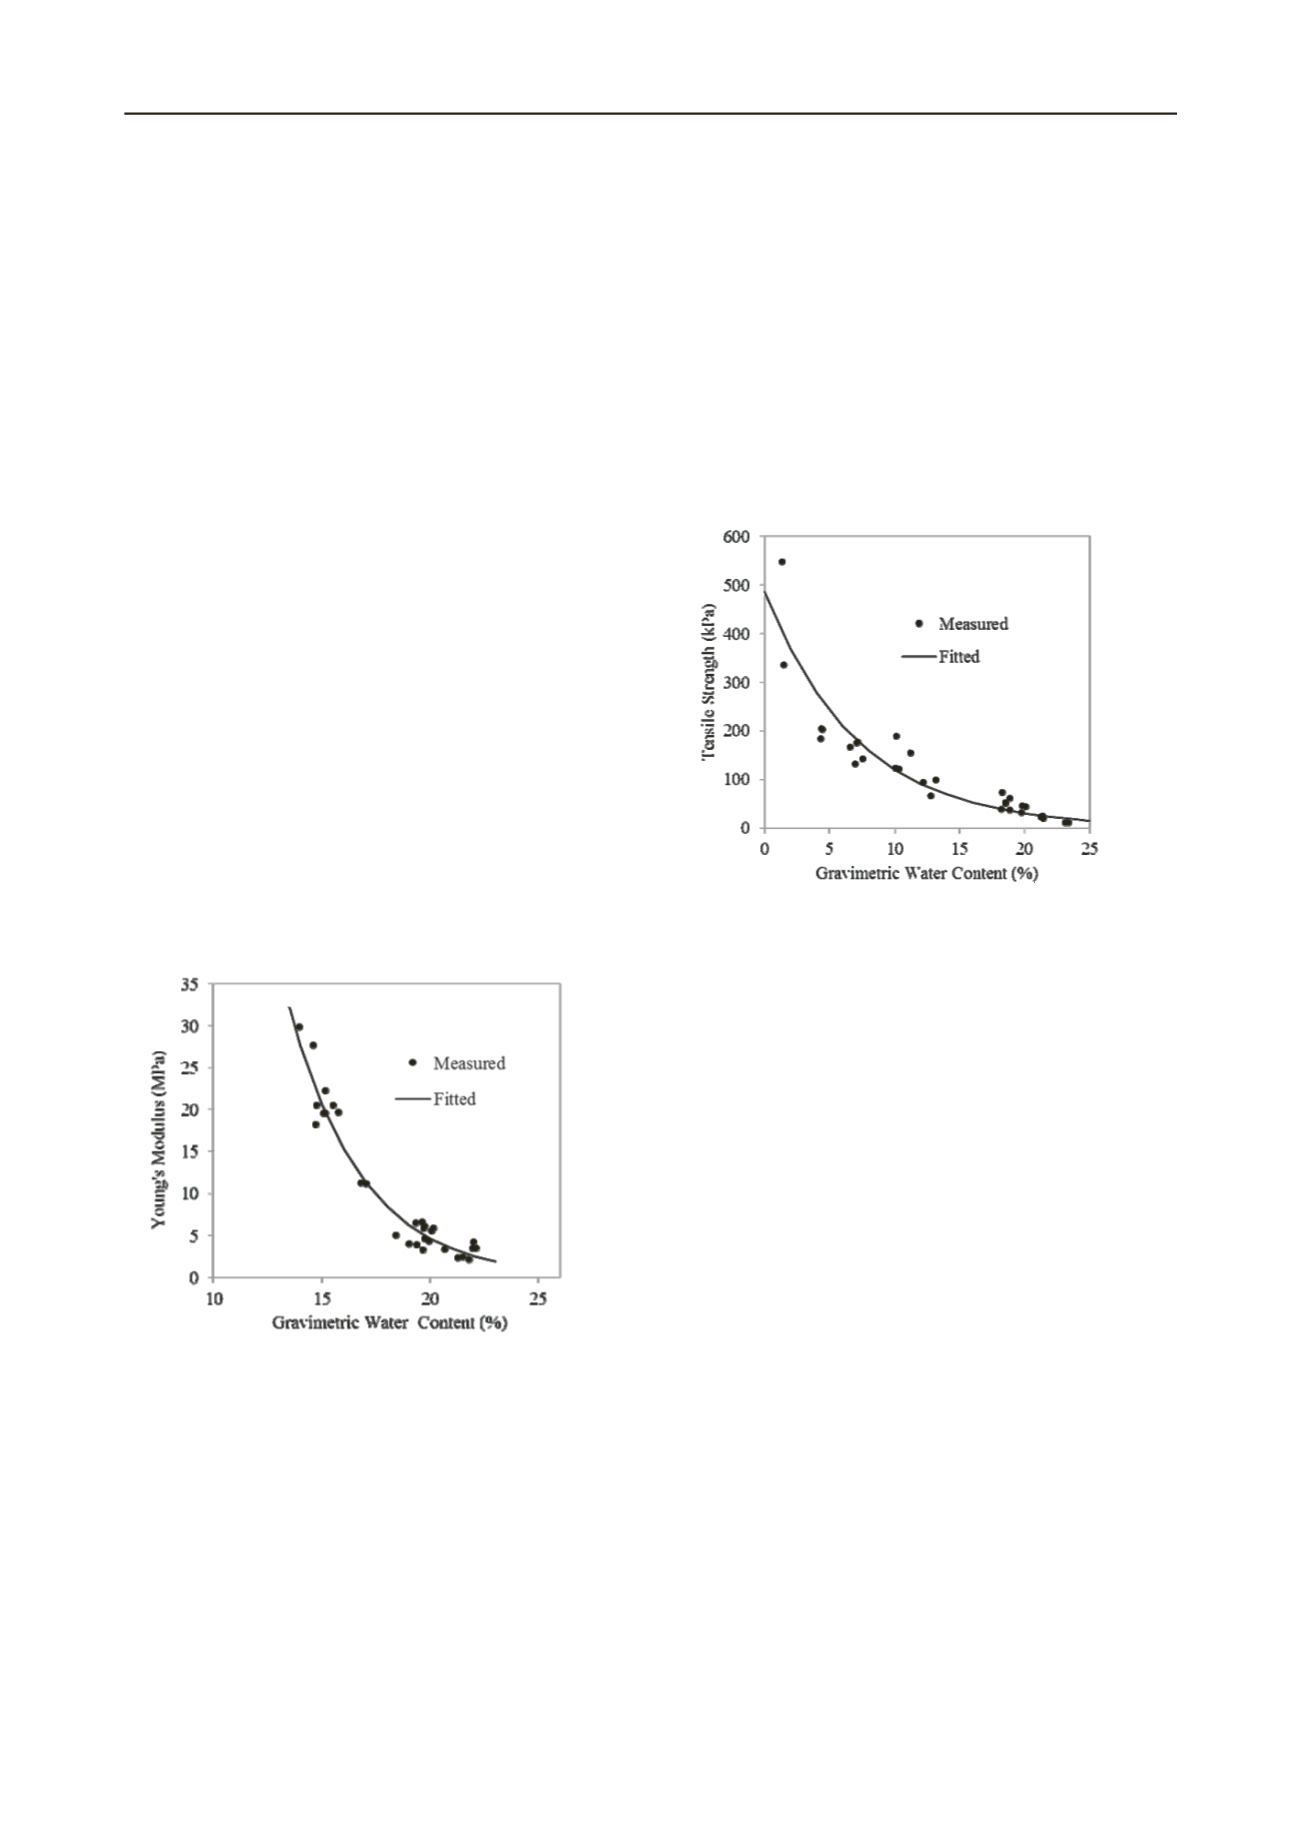
Young’s Modulus,
E
(MPa), in partially saturated soils is a
function of water content,
ω
(%), this relationship was derived
experimentally for the material modelled using constant water
triaxial tests. These data are presented in Figure 1.
The properties required by the software were dry density,
bulk and shear moduli. The bulk and shear moduli were
calculated using the Young’s modulus from Figure 1 and a
Poisson’s ratio of 0.3 (Tomlinson 2001). These moduli were
updated at each time-step of the analysis using code developed
in FISH and were based on changes in element water content.
The initial dry density of the soil was 1.65Mg/m
3
, based upon
sampling of a full scale trial embankment at Newcastle
University (Hughes et al 2007).
Figure 1 The trend in Young’s modulus at varying water content.
3.2 Interface properties
Interfaces were sited vertically throughout the mesh with
regular spacing. The use of interfaces enables separation of the
mesh into discrete regions between which slip and separation
can occur, subject to criteria set by interface properties and so
provide locations for potential cracking.
The Interface bond will break when tensile stresses exceed
the tensile strength or when shear stresses exceed the shear
strength of the individual interface. Separation can then occur
along the interface segment (delineated by node pairs) where
this condition is met.
The interface properties comprise the friction angle;
cohesion; tensile strength and stiffness in both the normal and
shear orientations. Interface property values were derived
primarily from standard laboratory tests (e.g. direct shear test).
However, interface normal and shear stiffness were calculated
according to the relative stiffness and size of neighbouring
elements. As with continuum stiffness, interface stiffness was
updated while stepping using the relationship with water
content.
The magnitude of tensile strength for a given soil is widely
recognised to be dependent upon the soil water content and
therefore, suction present (Heibrock et al 2003, Nahlawi et al
2004, Tamrakar et al 2005, Trabelsi et al 2011). Laboratory
testing was conducted using an adapted standard direct shear
apparatus on samples of the modelled clay at varying water
content. The identified trend input to the model is presented in
Figure 2.
Figure 2 Tensile strength of compacted clay as a function of water
content.
In addition to the dependency of interface tensile strength
with water content, variability in soil strength was also included
using a normally distributed random number facility about the
experimentally derived value. This variability was included to
enable a degree of the inherent heterogeneity of compacted clay
to be better captured. The implications of this method on crack
initiation and spacing is discussed later.
Restrained shrinkage at the base of clay has been shown to
have a great influence on the generation of the tensile stress that
leads to cracking (Peron, et al., 2009). The clay-mould interface
properties incorporated were based upon laboratory trials of
compacted clay shrinkage in specially constructed moulds.
3.3 Hydrological Properties
To implement the two-phase flow calculation, van
Genuchten properties of the clay were obtained from the soil
water retention curve established using the Filter Paper
Technique. These data are presented in Figure 3 alongside the
implemented fitted van Genuchten approximation.
The curve describes the general trend of increasing suction
with decreasing soil water content. It is this increase in suction
that is understood to bring about an increase in soil stiffness and
strength, in addition to shrinkage strain required for the
development of tensile stress.
The saturated mobility coefficient input to FLAC was
calculated from the coefficient of permeability and the dynamic
viscosity of water. The permeability value used was measured
from un-cracked sites on a trial embankment constructed using
the modelled clay fill (Hughes et al 2007).


