823
Technical Committee 103 /
Comité technique 103
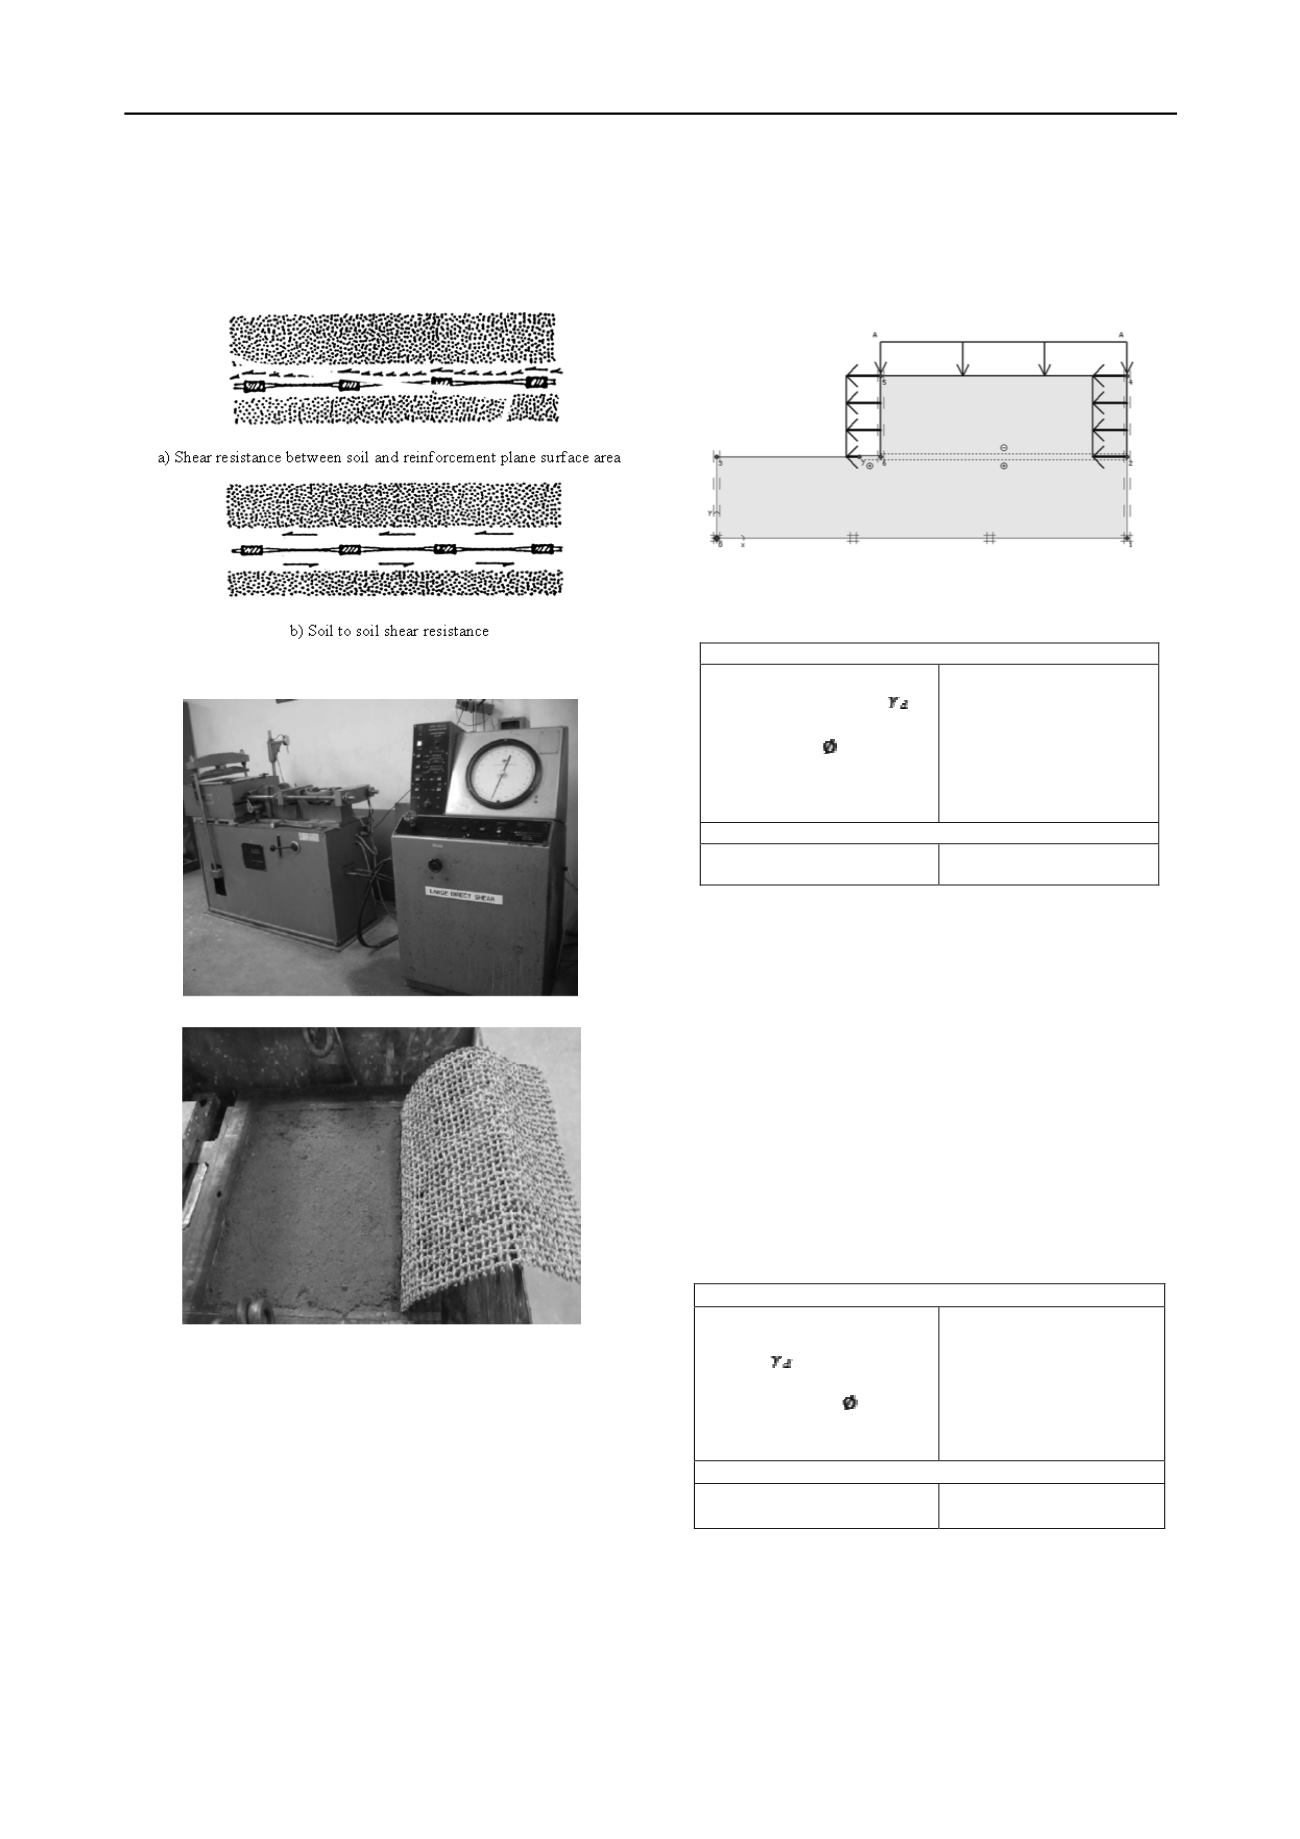
and backfill soil. A photograph of device is shown in Fig. 6
(Artidteang et al., 2012). Kenaf LLGs was prepared by
dimension of 300 mm by 500 mm and it was folded at one end
and placed between compacted backfill soils which compacted
to optimum moisture content in the upper and lower direct shear
box, as shown in Fig. 7.
Figure 5. Components of the direct shear resistance of grid
reinforcement (Jewell et al., 1984)
Figure 6. Large scale direct shear apparatus (Artidteang et al., 2012)
Figure 7. Kenaf LLGs folded with sand backfill (Artidteang et al., 2012)
4 NUMERICAL SIMULATION FOR LABORATORY
INVESTIGATION
4.1. Pullout test simulation
The interaction between soil and reinforcement (Kenaf geogrid)
can be simulated in term of pullout and direct shear tests of grid
and compacted sand by using PLAXIS. Six-node triangular
elements were used as soil elements, and geogrid elements were
used to simulate the reinforcement. The upper and lower
interface elements of the reinforcement were modeled by thin
layer elements. The elastic perfectly-plastic model was used to
simulate the behaviour of sand-geogrid interfaces. In PLAXIS
program, the shear modulus and strength parameters of the
interface were automatically calculated from the surrounding
soil parameters using the interaction coefficient, R. Air-bag
pressure was simulated by vertical loading applied directly to
the soil surface, and pullout loading was then given by applying
prescribed displacement to the reinforcement at the opening
front node of the pullout box to a desired value.
Finite element mesh for pullout box with PLAXIS program is
shown in Fig. 8. Table 1 shows the input parameter for pullout
test simulation.
Figure 8. Pullout test simulation
Table 1 Input parameters for pullout test simulation
Compacted Sand
Normal Stress
Maximum Dry Density,
Cohesion ,c
Friction Angle ,
Young Modulus, E
50
R
inter
20, 40, 60 kPa
18.1 kN/m
3
11.0 kN/m
2
35
o
6000 kN/m
2
0.5, 0.6, 0.7, 0.8, 0.9, 1.0
Kenaf Geogrid
Modulus of Elasticity, E
Length
50 kN/m
2
0.9 m.
4.2. Direct shear test simulation
The large scale direct shear box was modeled by as shown in
Fig. 9. Six-node triangular elements were used as soil elements,
and geogrid elements were used simulating the reinforcement.
The upper and lower interface elements of the reinforcement
were modeled by thin layer elements. The elastic perfectly-
plastic model was used to simulate the behaviour of soil-geogrid
interfaces. Air-bag pressure was simulated by vertical loading
applied directly to the soil surface, and shear loading was then
given by applying prescribed displacement to the side nodes of
the upper box. Finite element mesh for direct shear test with
PLAXIS program is shown in Fig. 5. Table 2 shows the input
parameter for direct shear test simulation.
Table 2 Input parameters for direct shear test simulation
Compacted Sand
Normal Stress
Maximum
Dry
Density,
Cohesion, c
Friction Angle,
Young Modulus, E
50
R
inter
40, 80, 120 kPa
18.1 kN/m
3
11.0 kN/m
2
35
o
6000 kN/m
2
0.5, 0.6, 0.7, 0.8, 0.9, 1.0
Kenaf Geogrid
Modulus of Elasticity, E
Length
50 kN/m
2
0.3 m.
5. RESULTS AND DISCUSSIONS
5.1. Pullout mode
In this study, the interaction coefficient (R) between the
reinforcement and backfill material was chosen as variable
parameter. The numerical simulations were conducted by
varying the interaction coefficient until the predicted results


