831
Technical Committee 103 /
Comité technique 103
general trend in the drained secant friction angle and pore
pressure response observed in the tests. The strength line fits
the data below 200 kPa well with the exception of one outlier,
which developed lower pore pressures during shear.
The
adjusted undrained strengths were calculated using R = 70 as
explained earlier.
The values of
’
1c
at each node were exported from the FE
analysis into a spreadsheet.
The undrained strength was
calculated for each node using the R = 70 adjusted strength
envelope shown in Figure 1. The undrained strength for each
element was then calculated by the FE software using TIN
interpolation from the nodal values.
0
50
100
0
50
100
150
200
Undrained shear strength, s
u
(kPa)
Major effective consolidation stress,
'
1c
(kPa)
ICU Data
ICU (R=100)
R = 70
Figure 1. Undrained strengths for Pilarcitos Dam analyses
Elastic-plastic stress strain behavior was used for the
drawdown analysis. Following the recommendation of Griffiths
and Lane (1999), a dilation angle of 0° was assumed. The
drawdown analysis was performed in two stages. In the first
stage, the initial body forces, stresses, and boundary conditions
for the normal operating conditions were applied. In the second
stage, the water level and reservoir loading were reduced to the
drawdown levels and a strength reduction analysis was
performed to evaluate the factor of safety. The critical strength
reduction factor, SRF
crit
, was calculated for the adjusted strength
with R = 70.
In Table 1, the strength reduction factor of safety is
compared to the limit equilibrium factor of safety calculated by
the Duncan, Wright, and Wong (DWW) method (1990) . It can
be seen that, with a value of R = 70, the finite element strength
reduction method is in close agreement with the widely-
accepted DWW method.
Table 1. Summary of RDD stability analyses for Pilarcitos Dam
Method of Analysis
Factor of Safety
Finite Element Strength Reduction
with R = 70
1.01
DWW Limit Equilibrium
1.04
1
Figure 2. Nodal displacement vectors from Pilarcitos Dam strength
reduction analysis, SRF
crit
= 1.01, R = 70
The nodal displacement vectors shown in Figure 2 illustrate
the failure mechanism predicted by the strength reduction
analysis. The proposed method predicts a relatively deep failure
zone that intersects the base of the embankment, whereas the
slip surface observed in the field encompasses a considerably
smaller portion of the embankment.
The cause of this
difference is not known.
3.2
Walter Bouldin Dam
In 1975, a rapid drawdown failure occurred at Walter Bouldin
Dam in Alabama when the water level in the reservoir dropped
9.8 m over the course of 5-1/2 hours. This catastrophic
drawdown rate was caused by the failure and breach of a
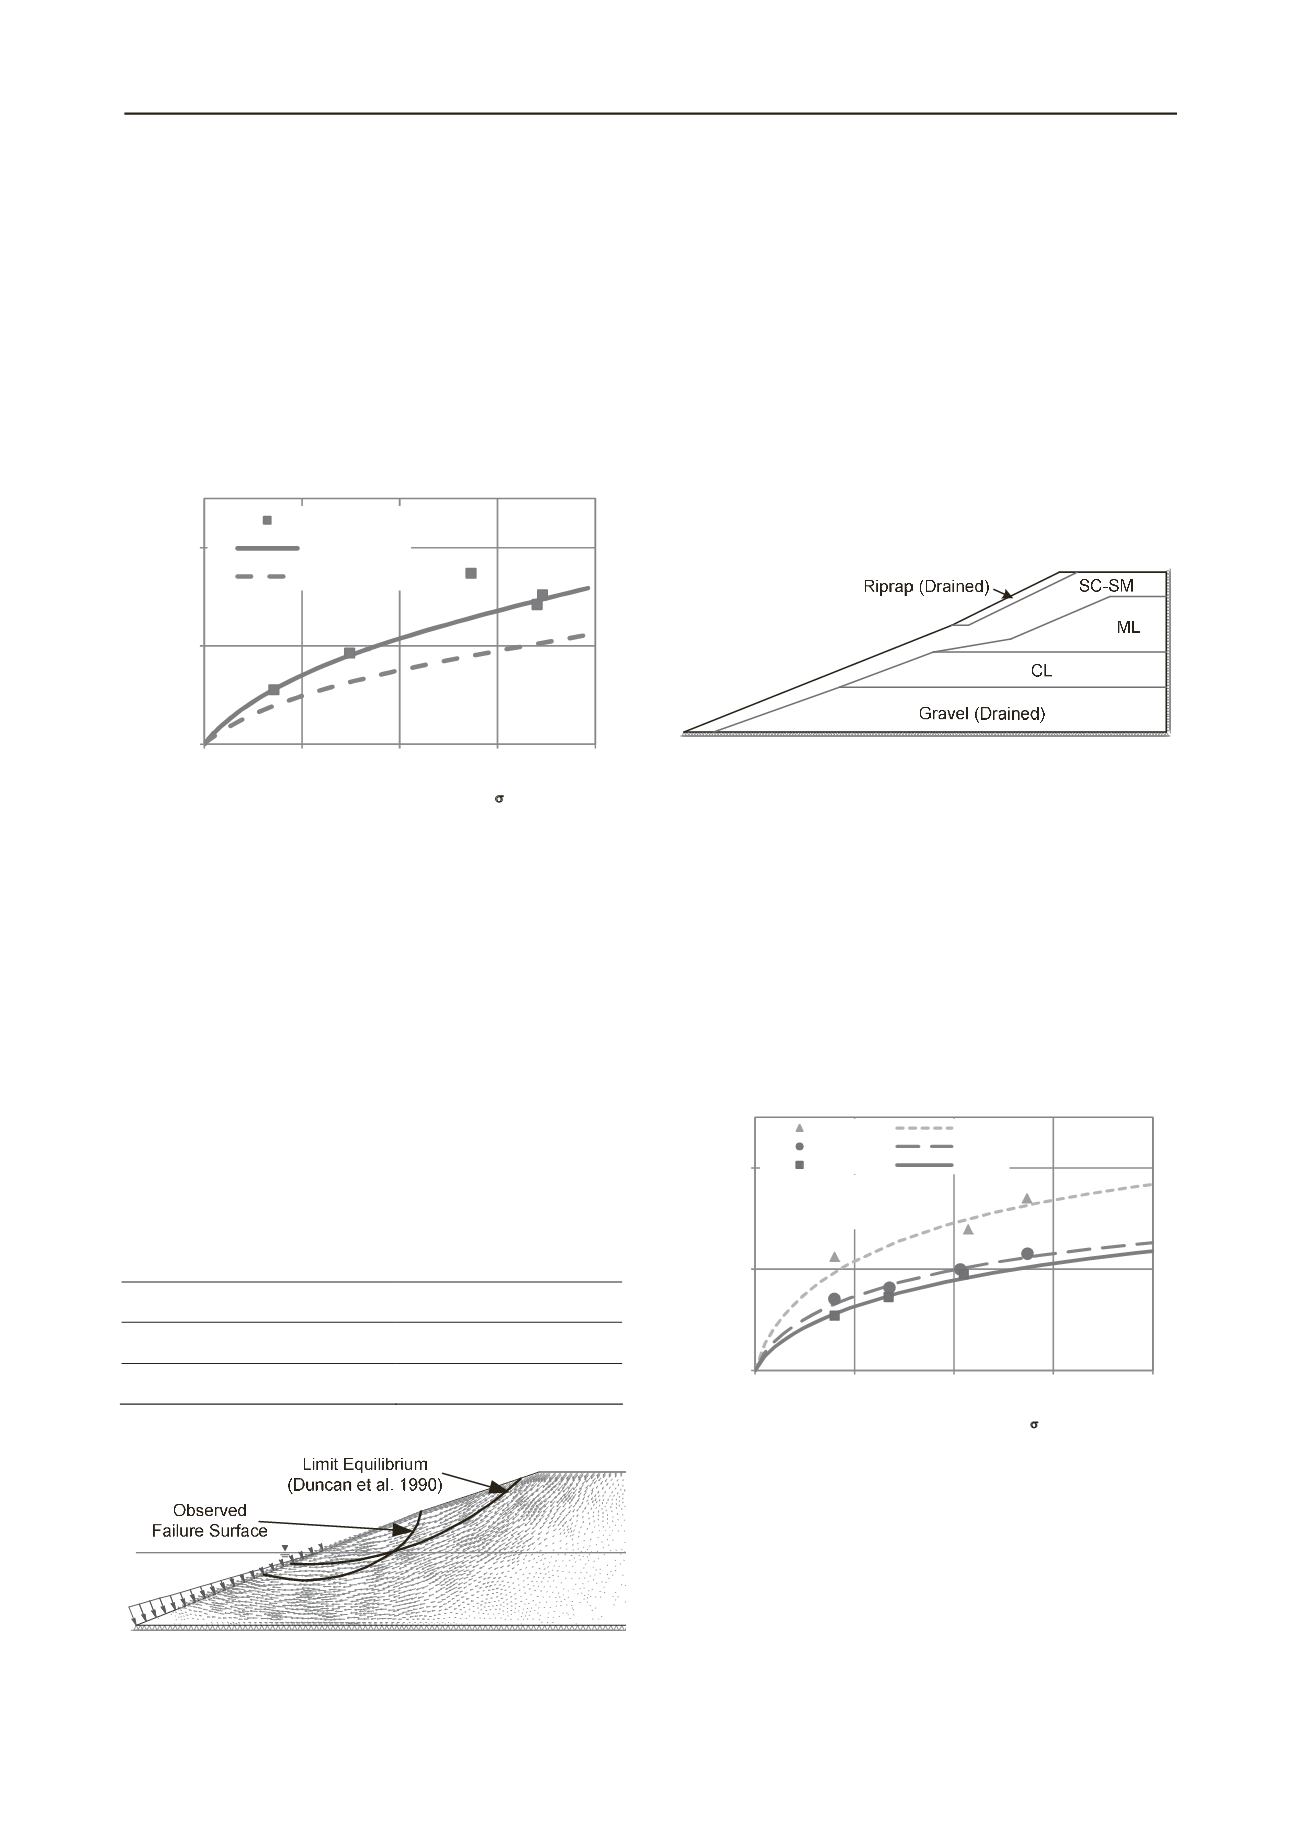
different section of the dam. The dam cross-section at the
location of the RDD failure is shown in Figure 3. The soils
were poorly compacted, which led to both the breach and the
RDD failure.
Figure 3. Cross-section of Walter Bouldin Dam
For the finite element consolidation stress analysis, the soils
were all assigned linear elastic stress strain properties with E =
47.9 MPa. The riprap and base layer of clayey sandy gravel
were assigned
= 0.3. The other three soils were assigned
=
0.35. Pore pressures corresponding to the full reservoir height
of 14.3 m above the base of the embankment were assigned
throughout the cross-section, assuming a horizontal piezometric
surface since the information required to perform a steady-state
seepage analysis was not available. The nodes along the base of
the embankment were fixed while the downstream boundary
was restrained in the horizontal direction.
The undrained strengths in Figure 4 are based on ICU
triaxial tests performed by Whiteside (1976).
0
50
100
0
50
100
150
200
Undrained shear strength, s
u
(kPa)
Major effective consolidation stress,
'
1c
(kPa)
SM-SC
SM-SC
ML
ML
CL
CL
Points - laboratory data
Lines - strength models
Figure 4. Undrained strengths (R=100) for Walter Bouldin Dam
The value of
’
1c
at each node calculated in the
consolidation analysis was exported into a spreadsheet, and
undrained strengths were calculated using the ICU strengths
shown in Figure 4. Adjusted strength values for each node were
calculated using the data in Figure 4, with R = 70. The adjusted
undrained strength of each element in the finite element mesh
was computed using TIN interpolation.
The factor of safety against slope instability was calculated
using the strength reduction method, as explained previously.
The results are summarized in Table 2. It can be seen that the
agreement is good between factors of safety calculated by the


