834
Proceedings of the 18
th
International Conference on Soil Mechanics and Geotechnical Engineering, Paris 2013
Soil Classification System describes the sand as a medium
grained, poorly graded, clean sand. Changi sand contains
approximately 12% of shells and has been used in a number of
experimental studies. Its index properties are given in
Wanatowski and Chu (2006, 2007).
2.2
Experimental set-up
All plane strain tests were performed in a plane-strain apparatus
developed by Wanatowski and Chu (2006). The plane-strain
condition was imposed by two metal vertical platens, fixed in
position by two pairs of horizontal tie rods. The lateral stress in
the
2
=0 direction (i.e. intermediate principal stress,
2
) was
measured by four submersible pressure cells with two on each
vertical platen.
The plane-strain testing system was fully automated. A
digital hydraulic force actuator was mounted at the bottom of a
loading frame to apply axial load. The actuator was controlled
by a computer via a digital load/displacement control box. The
control box adjusted the movement of the base pedestal to
achieve a desired rate of load or rate of displacement so that
either deformation-controlled or load-controlled loading mode
could be applied. The vertical load was measured by an internal
load cell. A pair of miniature submersible linear variable
differential transformers (LVDT) was used to measure the
vertical displacement. An external LVDT was also used to
measure the axial strain when the internal LVDTs run out of
travel. The cell pressure was applied through a digital
pressure/volume controller (DPVC). Another DPVC was used
to control the back pressure from the bottom of the specimen
while measuring the volumetric change at the same time. The
free-end technique (Rowe and Barden 1964) was adopted to
reduce the boundary frictions and to delay the occurrence of
non-homogeneous deformations. For details of the testing
arrangement, see Wanatowski and Chu (2006).
The triaxial experiments were carried out using a fully
automated triaxial testing system described by Chu and Leong
(2001). The testing system comprised of a computer, a triaxial
machine, a hydraulic actuator, and three digital pressure/volume
controllers (DPVCs) and a data-logger. The dimensions of the
triaxial specimen were 100 mm in diameter by 200 mm in
height. As in the plane-strain apparatus, the free-end technique
(Rowe and Barden 1964) was adopted in all the tests to
minimize the bedding errors and to delay the occurrence of non-
homogeneous deformations.
2.3
Results
The initial conditions of three isotropically consolidated
undrained (CIU) triaxial compression tests conducted on very
loose Changi sand are summarized in Table 1, where
1
,
2
and
3
are the vertical, zero strain horizontal, and in-plane
horizontal principal effective stresses respectively, p
0
is the
mean effective consolidation pressure and e
0
is the initial void
ratio.
Table 1. Summary of sample conditions prior to undrained shearing.
Type
Name
1
2
3
p
0
e
0
CIU
CU26 150
150
150
150 0.888
CIU
CU11 400
400
400
400 0.887
CIU
CU70 800
800
800
800 0.880
CK
0
U U04 139.5
91
59.5
97 0.935
CK
0
U U05
300
147
142
196 0.915
CK
0
U U06
458
246
189
298 0.899
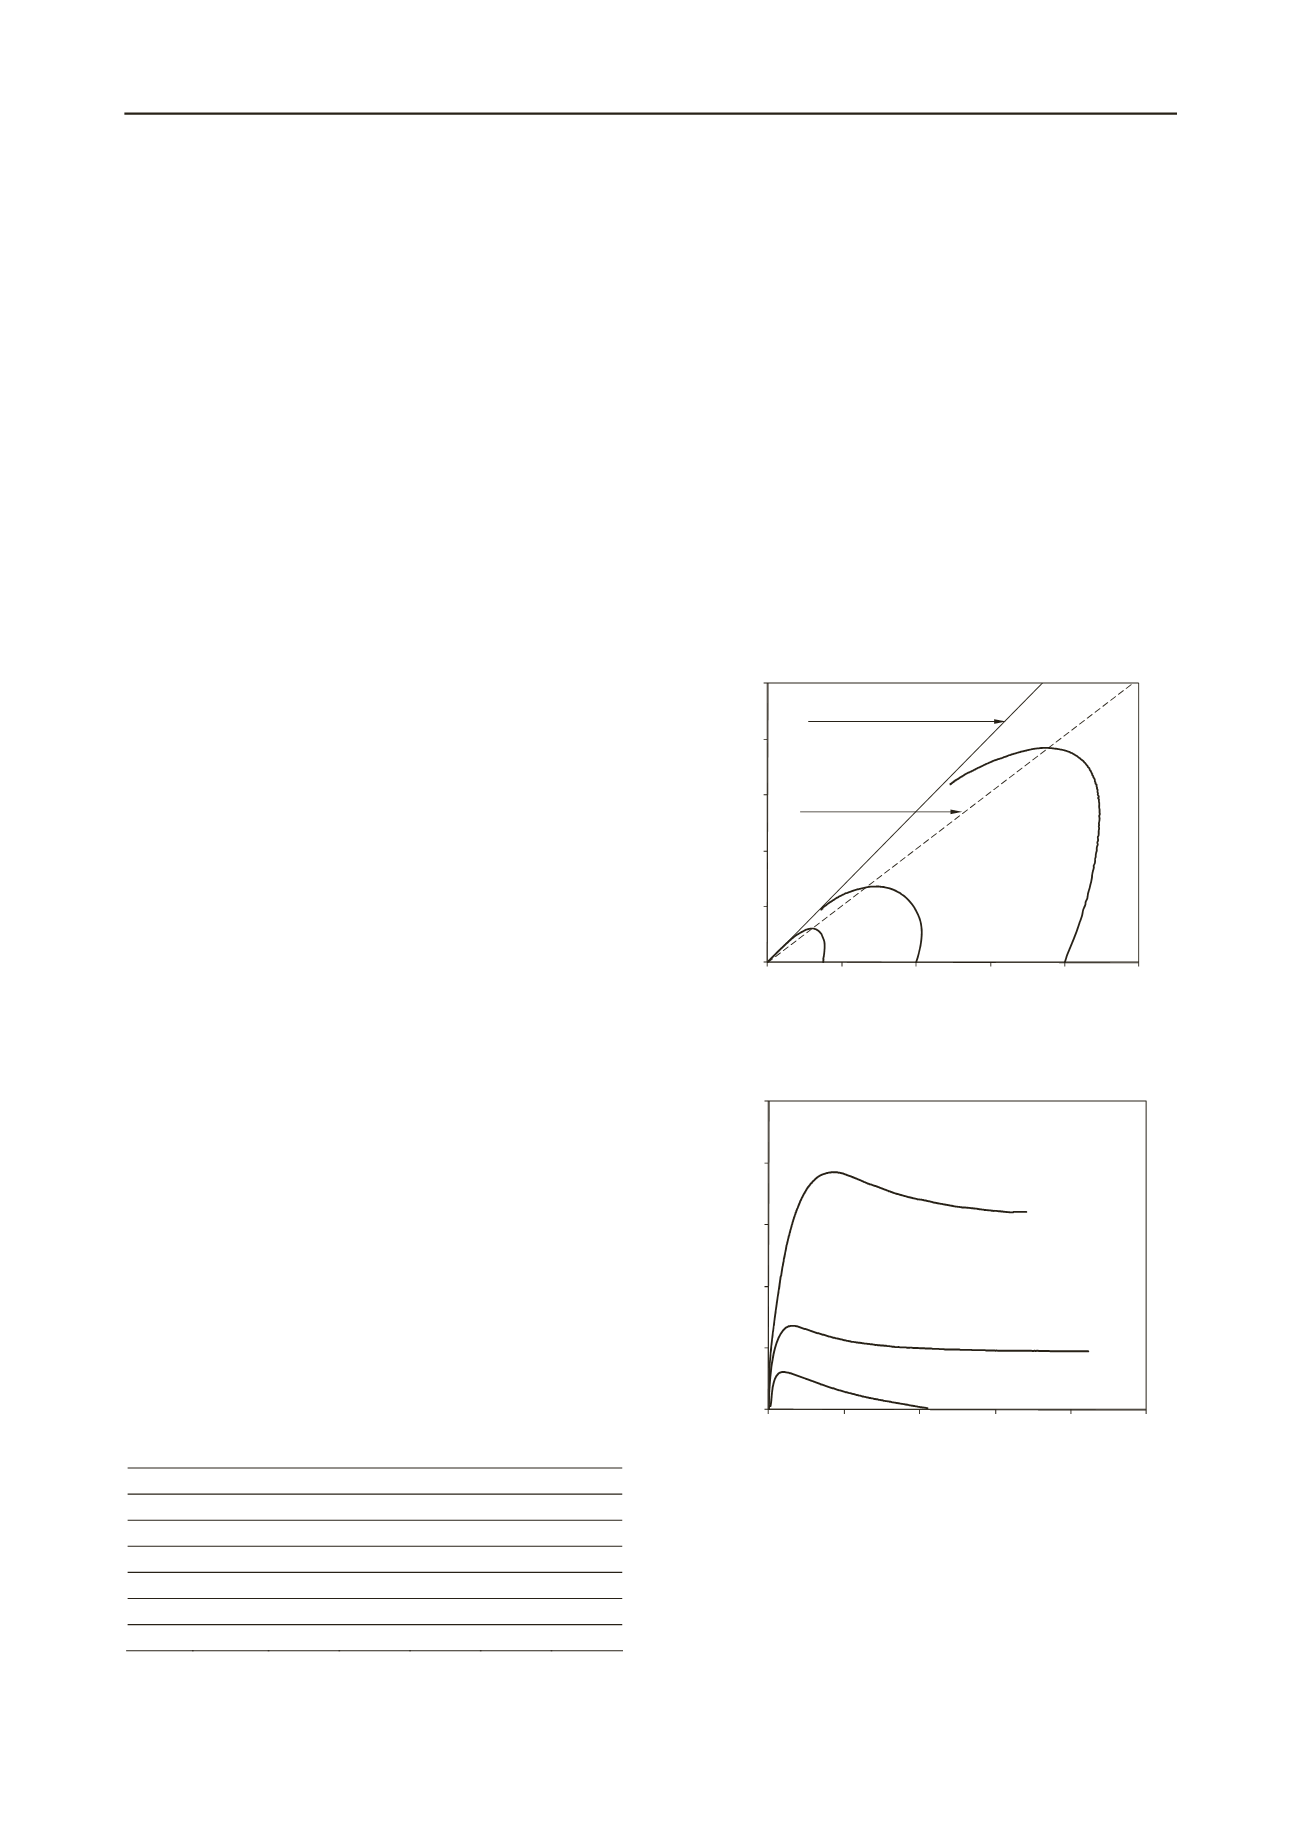
The effective stress paths of these tests are shown in Figure
1(a). The critical state line in triaxial compression (CSL
tc
)
determined from drained tests on very loose sand (Wanatowski
and Chu 2007, 2008) is also shown in Figure 1(a) and gives a
critical stress ratio, M
tc
, = 1.35, corresponding to a friction angle
of 33.4°. As shown in Figure 1(a), in all tests the effective stress
paths increased gradually towards the peak state and then traced
down towards the CSL suggesting flow liquefaction behaviour.
By connecting the peak points of the undrained stress paths
shown in Figure 1(a), the instability line (IL) as defined by Lade
(1993) can be determined. The zone bounded by the IL and the
CSL has been called the zone of instability in which loose sand
will become unstable when an undrained condition is imposed.
The stress-strain curves of the three CIU triaxial tests are
shown in Figure 1(b). All the stress-strain curves show a similar
response; that is a sharp increase in deviatoric stress to a peak
followed by strain softening. It can be seen from Figure 1(a)
that all the undrained effective stress paths were approaching
the CSL determined from CID tests on very loose sand
(Wanatowski and Chu 2006, 2007, 2008). Therefore, the CSL
shown in Figure 1(a) can be considered the same as the steady-
state line (SSL) for axisymmetric conditions (Poulos et al
1985).
0
200
400
600
800
1000
0
200
400
600
800
1000
Deviatoric stress invariant, q (kPa)
Mean effective stress, p' (kPa)
CSL
tc
(
tc
= 1.35)
(from CID triaxial tests)
CU11
CU26
CU70
Instability Line
(a)
0
200
400
600
800
1000
0
5
10
15
20
25
Deviatoric stress invariant, q (kPa)
Major principal strain,
1
(%)
CU11, e
0
= 0.887
CU70, e
0
= 0.880
CU26, e
0
= 0.888
(b)
Figure 1. Results of CIU triaxial tests on loose Changi sand.
Table 1 also summarizes the initial conditions of three K
0
consolidated undrained (CK
0
U) plane-strain compression tests
carried out on loose Changi sand. The effective stress paths and
the stress-strain curves of these tests are presented in Figures
2(a) and 2(b), respectively. The critical state line in plane strain
(CSL
psc
) as determined by drained CK
0
D plane-strain tests on
loose Changi sand (Wanatowski and Chu 2006, 2007) is also


