842
Proceedings of the 18
th
International Conference on Soil Mechanics and Geotechnical Engineering, Paris 2013
analysis was performed on the overconsolidated ground that
was not affected by the surface load (material constants and
initial values were estimated based on Noda et al. 2007).
Loading was accomplished in two ways, either by controlling
the displacement or by controlling the load. In the displacement
controlled case, a forced vertical displacement was imposed on
the central node of the foundation at a sufficiently fast rate
(10
-5
cm/sec) to ensure little migration of pore water within the
ground. In the load controlled case, a load was added to the
central node of the foundation at a rate of 0.015 kPa/sec. The
loading rate, in this case, was adjusted so that the total time
required to reach the peak load obtained by displacement
control would be approximately the same as in the displacement
controlled case.
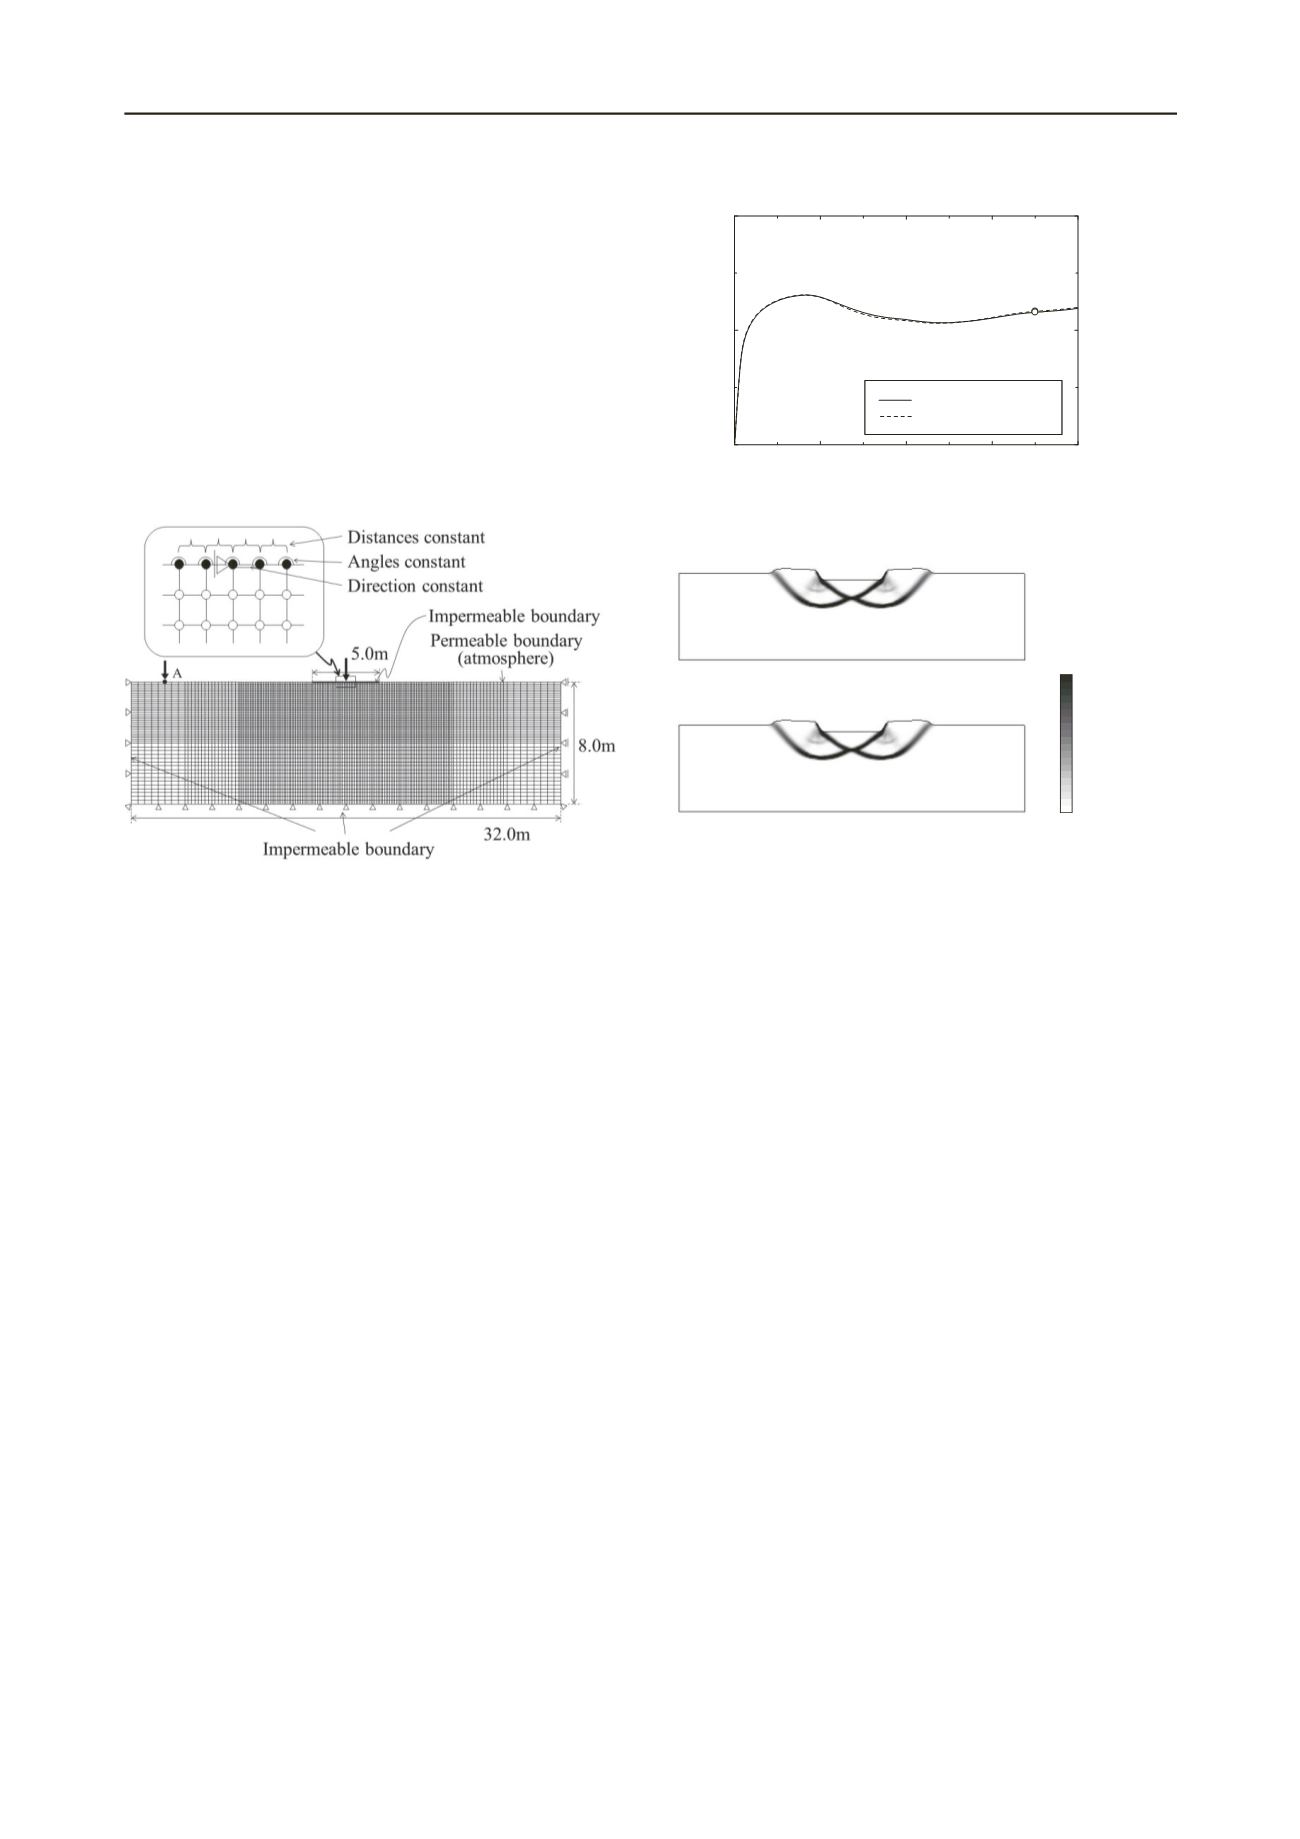
Figure 1. Finite element mesh and boundary conditions.
3 BEARING CAPACITY ANALYSIS UNDER DISPLACE-
MENT AND LOAD CONTROLLED CONDITIONS
In this paper, the bearing capacity analyses were conducted
under both the displacement controlled and load controlled
conditions employing a “quasi-static” approach, whereby the
inertia term is ignored and only the equilibrium of force is taken
into consideration, and a dynamic approach, whereby time
integration of the equation of motion enables the handling of
dynamic problems. In so doing, we demonstrate the need to
account for inertial force when simulating the behavior, which
includes accelerated motion, of soil undergoing failure.
3.1 Displacement controlled case
Here we consider the effect of inclusion (or omission) of the
inertial term in the displacement controlled case. The
relationship between load and settlement and the shear strain
distributions are presented in Figures 2 and 3, respectively.
First, it is evident that inclusion (or omission) of the inertial
term has little or no effect on the simulation outcome. This is
because, in the displacement controlled case where the
foundation is moved at a constant velocity, the resulting ground
acceleration is negligible and can, for all practical purposes, be
ignored. Furthermore, it can be seen that, in the displacement
controlled case, the deformation is localized and results in the
development of a circular slip failure accompanied by load
reduction. Such behavior characteristically occurs when a
highly structured naturally deposited clay ground experiences
rapid loading, with the soil components above the slip line
exhibiting softening accompanied by plastic compression (Noda
et al. 2007). In addition, it can be seen how the load increases a
second time when displacement continues to be imposed after
the initial reduction in load. As is evident from the upheaval of
ground on either side of the foundation, this can be attributed to
uplifting of the slipped soil mass and can be said to be the result
of finite deformation.
10
20
30
40
100
200
0
Settlement (cm)
Vertical load (kPa)
with inertial term
without inertial term
(a)
Figure 2. Relationship between vertical load and settlement
(displacement controlled case).
(a) Settlement 35cm
(A) With inertial term
100
(a) Settlement 35cm
(%)
s
0
(B) Without inertial term
Figure 3. Shear strain distributions (displacement controlled case).
3.2 Load controlled case
Next, we examine the effects of the inertial term in the load
controlled case. The relationship between load and settlement is
presented in Figure 4. The results for the displacement
controlled case (with inertial term) are shown in the same
figure. The quasi-static approach not accounting for the inertia
term only allows simulation up to point (a) in Figure 4, which
represents the peak load in the displacement controlled case. In
contrast, the dynamic approach enables the simulation to
continue beyond the point of peak load in the displacement
controlled case. We see that the load continues to cause nearly
constant settlement, and the load begins to increase again after a
certain point. The shear strain distributions corresponding to
time points (a) to (c) in Figure 4 are presented in Figure 5. In
the simulation including the inertial term, the deformation is
localized, resulting in development of a circular slip line similar
to that observed in the displacement controlled case. The time
histories of vertical acceleration, velocity, and displacement
(positive in the downward direction) for the central node of the
foundation are presented in Figure 6. (Only velocity data is
shown for the quasi-static analysis.) It can be seen in the
dynamic analysis that accelerated motion begins after point (a)
on Figure 6, which represents the peak load in the displacement
controlled case. After reaching a peak, acceleration transitions
to deceleration and motion once again converges to
approximately zero through repeated cycles of acceleration and
deceleration. In accordance with this acceleration history,
velocity reaches a peak and thereafter converges to zero. During
this time, displacement continues to increase, resulting in
settlement on the order of 80 cm. A mere 2 to 3 seconds are
required for this movement to occur. The majority of the nearly-
constant settlement due to load seen in Figure 4 occurs during
this short time. Meanwhile, it can be seen in Figure 6 (B) that
velocity increases rapidly even in the case of the quasi-static


