839
Technical Committee 103 /
Comité technique 103
parameters. Comparison of the ultimate bearing capacity
predicted results and the measurement results (Q
ult
_p / Q
ult
_M) were used as a comparative analysis of variables.
Comparison of Q
ult
_p / Q
ult
_M in the range of 0 to
with
optimum value equal to one. Mean (
) and standard deviation
(σ) of Q
ult
_p /Q
ult
_M was an indicator of the accuracy and
precision of the method was analyzed.
4. RESEARCH FINDINGS
Final Model of NN_Qult have a 3 network configuration
hidden nodes were trained on the 1000 epoch, learning rate =
0.5 and momentum = 0.5. Connection weights and bias values
NN_Q
ult
models are summarized in Table 1. Image network
architecture shown in Figure 2 NN_Q
ult
models, has 4 (four)
input variables (d, L, N60 (shaft), and N60 (tip)) and 1 (one)
variable output (Q
ult
).
Tabel 1. Weight and bias for
NN_Q
ult
Model
Figure 2. Network structure of
NN_Q
ult
Model
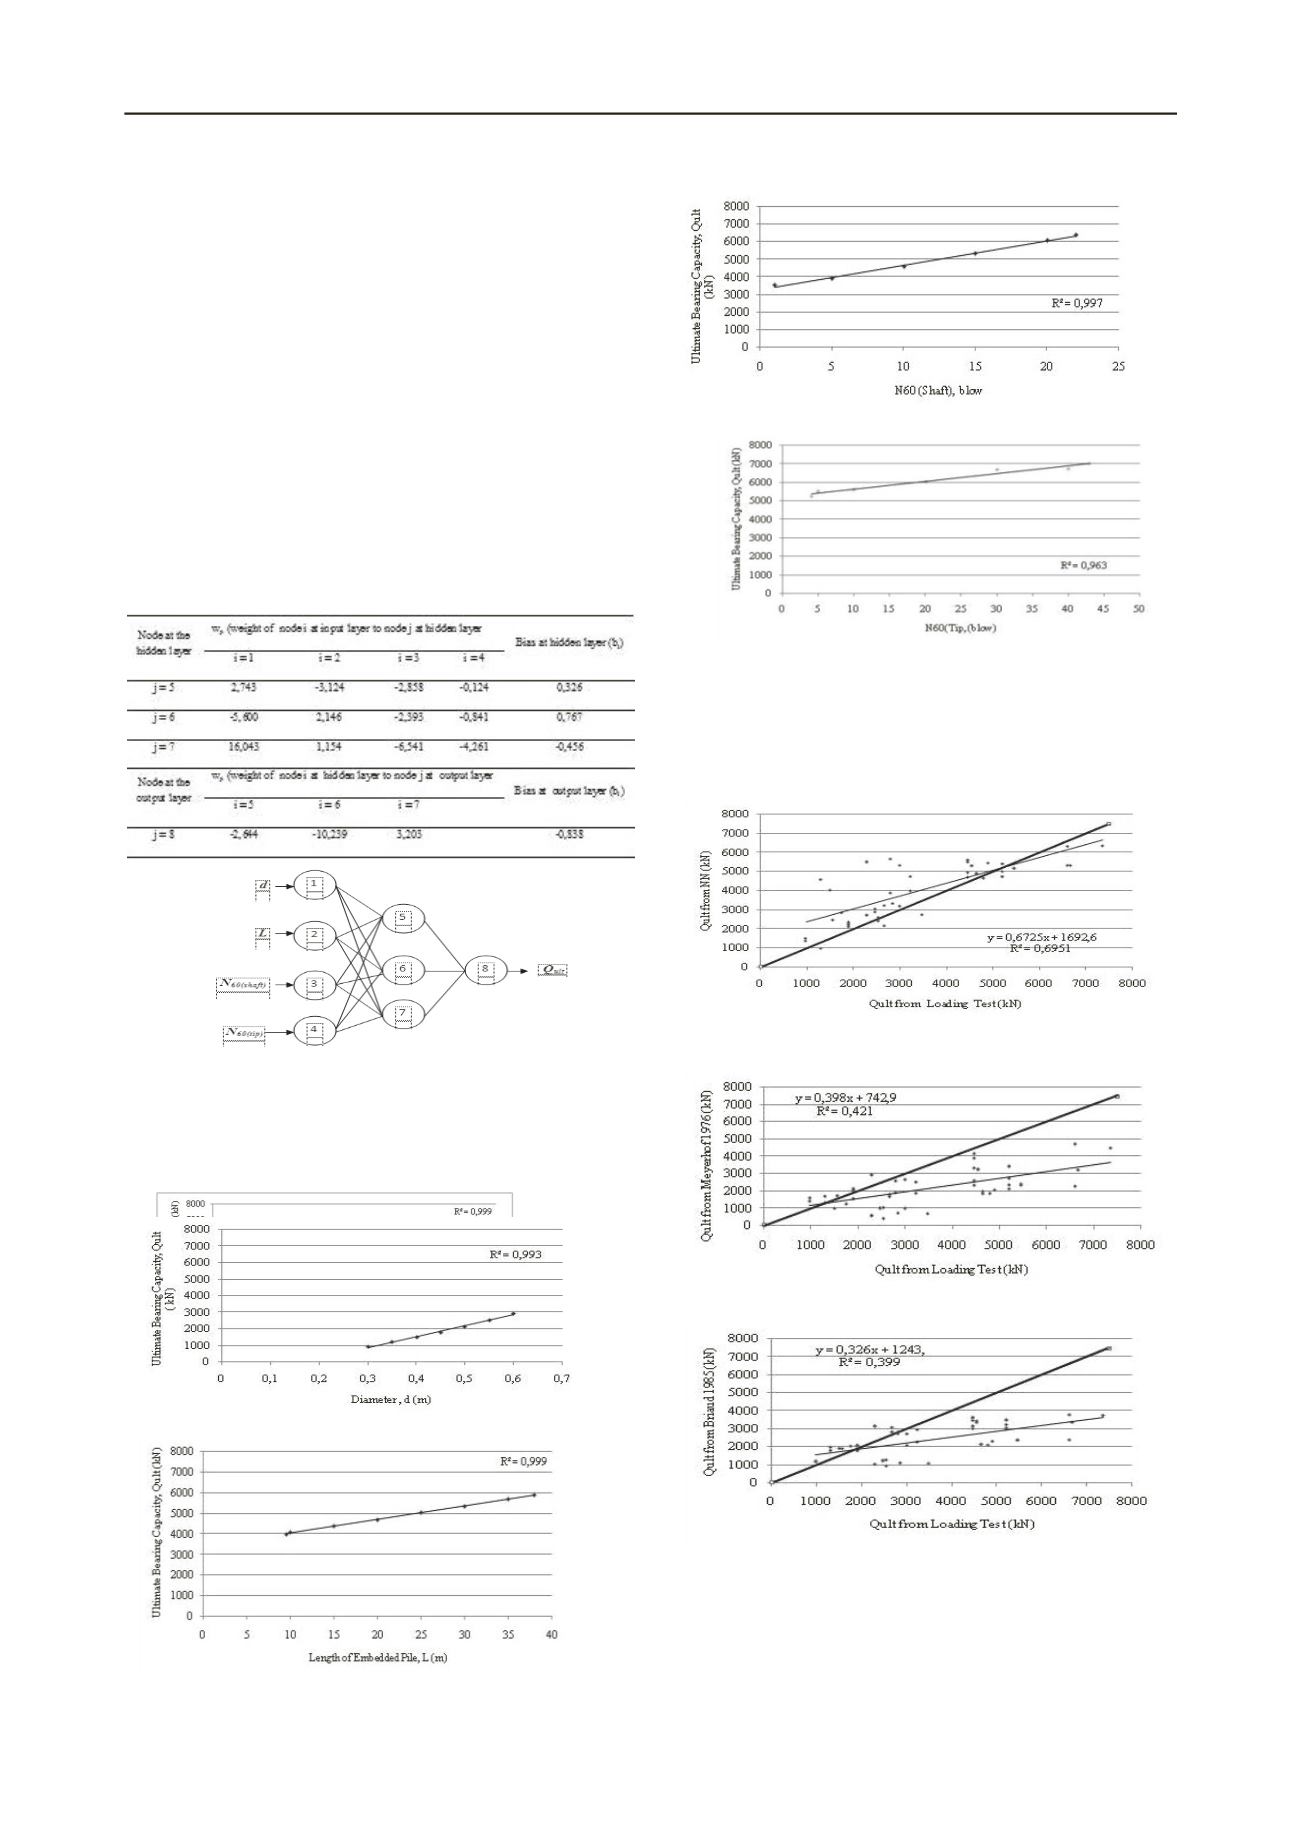
4.1 Sensitivity Analysis of NN_Q
ult
Model
Sensitivity analysis of NN_Q
ult
model was performed on four
input variables, namely: d, L, N60 (shaft), and N60 (tip). The
results of sensitivity analysis are given in Figure 3 to Figure 6.
Figure 3. Graph of Relation of versus
Q
ult
Variable
Figure 4. Graph of Relation of
N
60(shaft)
versus
Q
ult
Variable
Figure 5. Graph of Relation of
N
60(shaft)
versus
Q
ult
Variable
Figure 6. Graph of Relation of
N
60(tip)
versus
Q
ult
Variable
4.2 Result of Model Calibration
4.2.1
Graphically Method Evaluation
Result of Model calibration by graphically method can be seen
in Figure 7 until Figure 9.
Figure 7. Calculation Result of
Q
ult
from
NN_Q
ult
and Static Loading Test.
Figure 8.
Q
ult
from Meyerhof 1976 and Static Loading Test
Figure 9.
Q
ult
from Briaud 1985 and Static Loading Test
Based on Graphically evaluation, there were two values
reviewed, namely coefficient of determination (R
2
) and the
gradient/slope of the regression line (m).
R
2
value close to 1
(one) means that the regression line closer to the data
distribution. Value of
m
close to 1 (one) means that the
regression line close to the best fit line, it is the line


