824
Proceedings of the 18
th
International Conference on Soil Mechanics and Geotechnical Engineering, Paris 2013
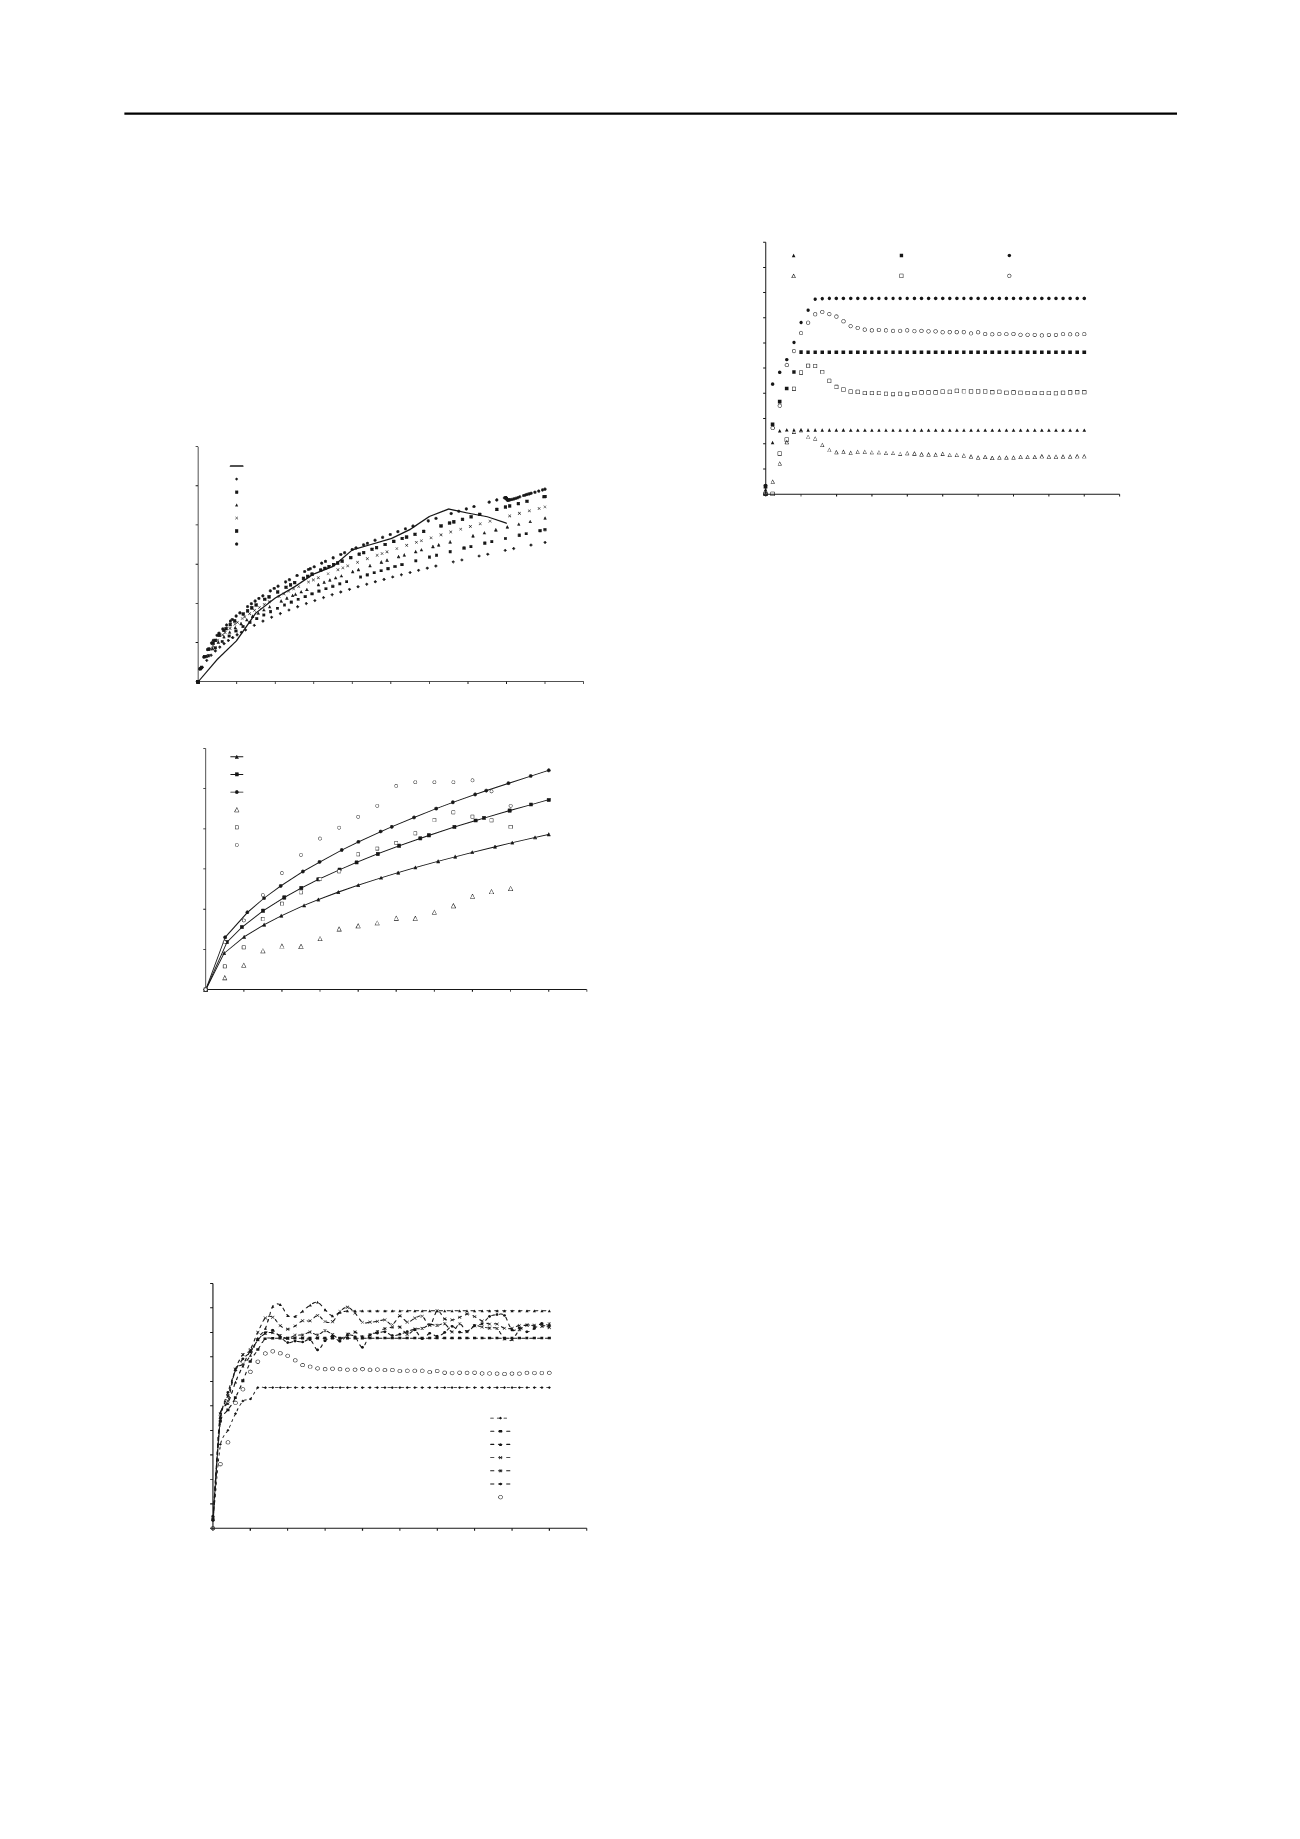
coincide with the laboratory results as shown in Fig 10. The
comparison between laboratory test and predicted results are
made in Fig. 11 for pullout test. The results of simulation
captured well with laboratory test results.
After the maximum pullout resistance, the predicted results
show constant residual strength as compared to the measured
results. The reason might be consideration of PLAXIS to
geogrid element as rough sheet which did not show any
damages in geogrid as it occurred in laboratory. Average back-
calculated interaction factor for Kenaf and compacted sand is
0.9 in pullout mode.
Figure 9. Parametric study of R
inter
for normal stress of 40 kPa.
Figure 10. Pullout test between FEM and laboratory test results
5.2. Direct shear mode
For direct shear test simulation, the interaction coefficient (R)
also varied in order to parametric study for this variable as
shown in Fig. 12. The sensitivity analysis show that the
interaction coefficient (R) of 0.6 is good fit with laboratory
results. The comparison between laboratory test and predicted
results are made in Fig. 13 for direct shear test. The results of
simulation captured well with laboratory test results.
Figure 11. Parametric study of R
inter
for normal stress of 120 kPa.
Figure 12. Direct shear test between FEM and laboratory test results
6. CONCLUSIONS
The purposes of this study are to assess the interactions between
the Kenaf geogrid and compacted sand as well as perform the
numerical simulations by finite element analyses. Sensitivity
analyses were also performed for the pullout and direct shear
test by varying the interaction coefficient. The back-calculated
from numerical simulations average values of interaction
coefficients were found to be similar as to the measured results.
The interaction coefficient and axial stiffness of the geogrid
were found to be important parameters affecting the efficiency
of geogrid. The interaction coefficient R
inter
is 0.9 for pullout
mechanism and 0.6 for direct shear mechanism. These
parameters are useful for analysis and design of reinforced soil
structure using kenaf geogrid and compacted sand. Limited Life
Geotextiles (LLGs) from Kenaf geogrid can be used as natural
fibers for sustainable geosynthetics.
7. ACKNOWLEDGEMENTS
This study is part of research granted by Thailand Research
Fund (TRF) in cooperated with Commission of Higher
Education and Chiang Mai University under New Researcher
Project FY 2011. Laboratory test data were obtained from the
Asian Center for Soil Improvement and Geosynthetics (ACSIG)
of the Asian Institute of Technology, Bangkok, Thailand.
8. REFERENCES
Artidteang S., Bergado D. T., Tanchaisawat T. and Saowapakpiboon S.
2012. Investigation of tensile and soil-geotextile interface strength
of kenaf woven limited life geotextiles (LLGs).
Lowland
Technology International,
14(2), 1-8.
Belton J. 2008. Using geosynthetics to meet the challenge of improving
material resource efficiency.
Proceedings of EuroGeo4
, Scotland,
Paper #128, 7-10
Brinkgreve R. B. and Broere W. 2003.
PLAXIS 2D Version 8 Manual
.
Balkema, A. A., Rotterdam, Brookfield, Netherland.
Jewell R. A., Milligan G. W. E., Sarsby R. W. and Dubois D. 1984.
Interaction between soil and geogrids,
Proceedings of
the
Symposium on Polymer Grid Reinforcement in Civil Eng
., Thomas
Telford Limited, London, U.K., 19-29.
Mwasha A. 2005. Limited life geotextiles for reinforcing an
embankment on soft ground.
PhD Thesis
, University of
Wolverhampton, U.K.
Mwasha A. and Sarsby R. 2003. Use of vegetable fibre geotextiles
(VFGs) for ground improvement.
Proceedings Cobra
, University
Wolverhampton, U.K.
Robinson P. N. J. and Quirk C. M. 2008. The UK aggregate levy and its
implications to geosynthetics.
Proceedings of EuroGeo4
, Scotland.
Sarsby R., Mwasha A., Searle D. and Karri R. S. 2008. Sisal fibre
geotextiles for soil strengthening.
Proceedings of the 8th
International Geosynthetics Conference
, Millpress Science
Publisher. ISBN:90 5966 044 7.
0.00
10.00
20.00
30.00
40.00
50.00
60.00
70.00
80.00
90.00
100.00
0.000 0.005 0.010 0.015 0.020 0.025 0.030 0.035 0.040 0.045 0.050
Shear Stress (kPa)
Horizontal Displacement (m)
σ=
40kPa (FEM)
σ= 80
kPa (FEM)
σ= 120
kPa (FEM)
σ=40
kPa (Lab Results)
σ= 80
kPa (Lab Results)
σ=
120 kPa (Lab Results)
0.00
10.00
20.00
30.00
40.00
50.00
60.00
70.00
80.00
90.00
100.00
0.000 0.005 0.010 0.015 0.020 0.025 0.030 0.035 0.040 0.045 0.050
ShearStress(kPa)
Horizontal Displacement (m)
R=0.5 FEM
R=0.6 FEM
R=0.7 FEM
R=0.8 FEM
R=0.9 FEM
R=1.0 FEM
Lab Results
0.00
5.00
10.00
15.00
20.00
25.00
30.00
0.000
0.010
0.020
0.030
0.040
0.050
0.060
0.070
0.080
0.090
0.100
Pullout Force (kN/m)
Horizontal Displacement (m)
= 40
LAB
R0.5FEM
R0.6FEM
R0.7FEM
R0.8FEM
R0.9FEM
R1.0FEM
0.00
5.00
10.00
15.00
20.00
25.00
30.00
0.000
0.010
0.020
0.030
0.040
0.050
0.060
0.070
0.080
0.090
0.100
Pullout Force (kN/m)
Horizontal Displacement (m)
σ=
20kPa(FEM)
σ=
40kPa(FEM)
σ= 60
kPa(FEM)
σ= 20
kPa(LAB)
σ= 40
kPa(LAB)
σ= 60
kPa(LAB)
R = 0.9


