2980
Proceedings of the 18
th
International Conference on Soil Mechanics and Geotechnical Engineering, Paris 2013
Proceedings of the 18
th
International Conference on Soil Mechanics and Geotechnical Engineering, Paris 2013
5.2
Excess Pore Water Pressure
The calculated results are compared with the measured excess
pore water pressure at varies depths. Excess pore pressures were
monitored using vibrating wire (VW) piezometers installed at
centre of trial embankment.
Figure 6
shows the excess pore
water pressure profiles at depths of 2m, 3m, 4m, 8m and 10m
versus embankment filling time. Generally, the measured pore
water pressure increased during filling and dissipated during
surcharge period. At 1
st
stage of filling (up to 3.9m), the VW
piezometers indicated that the excess pore pressure at depth of
2m, 3m, 4m, 8m and 10m were 21kPa, 27kPa, 32kPa, 35kPa
and 31kPa respectively. The measured excess pore pressure at
depth of 2m is about 6kPa less than calculated result. However,
the measured excess pore pressures at 3m depth and below are
less than the calculated result with various pressure of 7kPa to
22kPa. The calculated result over predicted the excess pore
pressure by more than 50% for depth at 4m and below. At 2
nd
stage of filling (up to 5.8m), the difference between measured
and calculated results were less than 5kPa for depth of 4m and
below. However, the calculated result over predicted the excess
pore water pressure by more than 50% for depth of 3m and
above.
VW piezometer results were corrected based on the
measured settlement from extensometer at various depths. This
is because the VW piezometers embedded into subsoil will
settle together with subsoil during consolidation process. Some
of the extensometers were damaged at 3
rd
stage of filling works.
Therefore, the VW piezometer results at depth of 8m and 10m
were not presented for 3
rd
stage filling.
0
2
4
6
8
10
Fill Thickness (m)
0
50
100
150
200
250
300
350
400
450
0
10
20
30
Excess Pore
Pressure (kPa)
0
10
20
30
Excess Pore
Pressure (kPa)
0
10
20
30
Excess Pore
Pressure (kPa)
0
10
20
30
Excess pore
Pressure (kPa)
0
10
20
30
Excess Pore
Pressure (kPa)
Time (day)
At depth of 2m
At depth of 3m
At depth of 4m
At depth of 10m
At depth of 8m
Measurement
Prediction
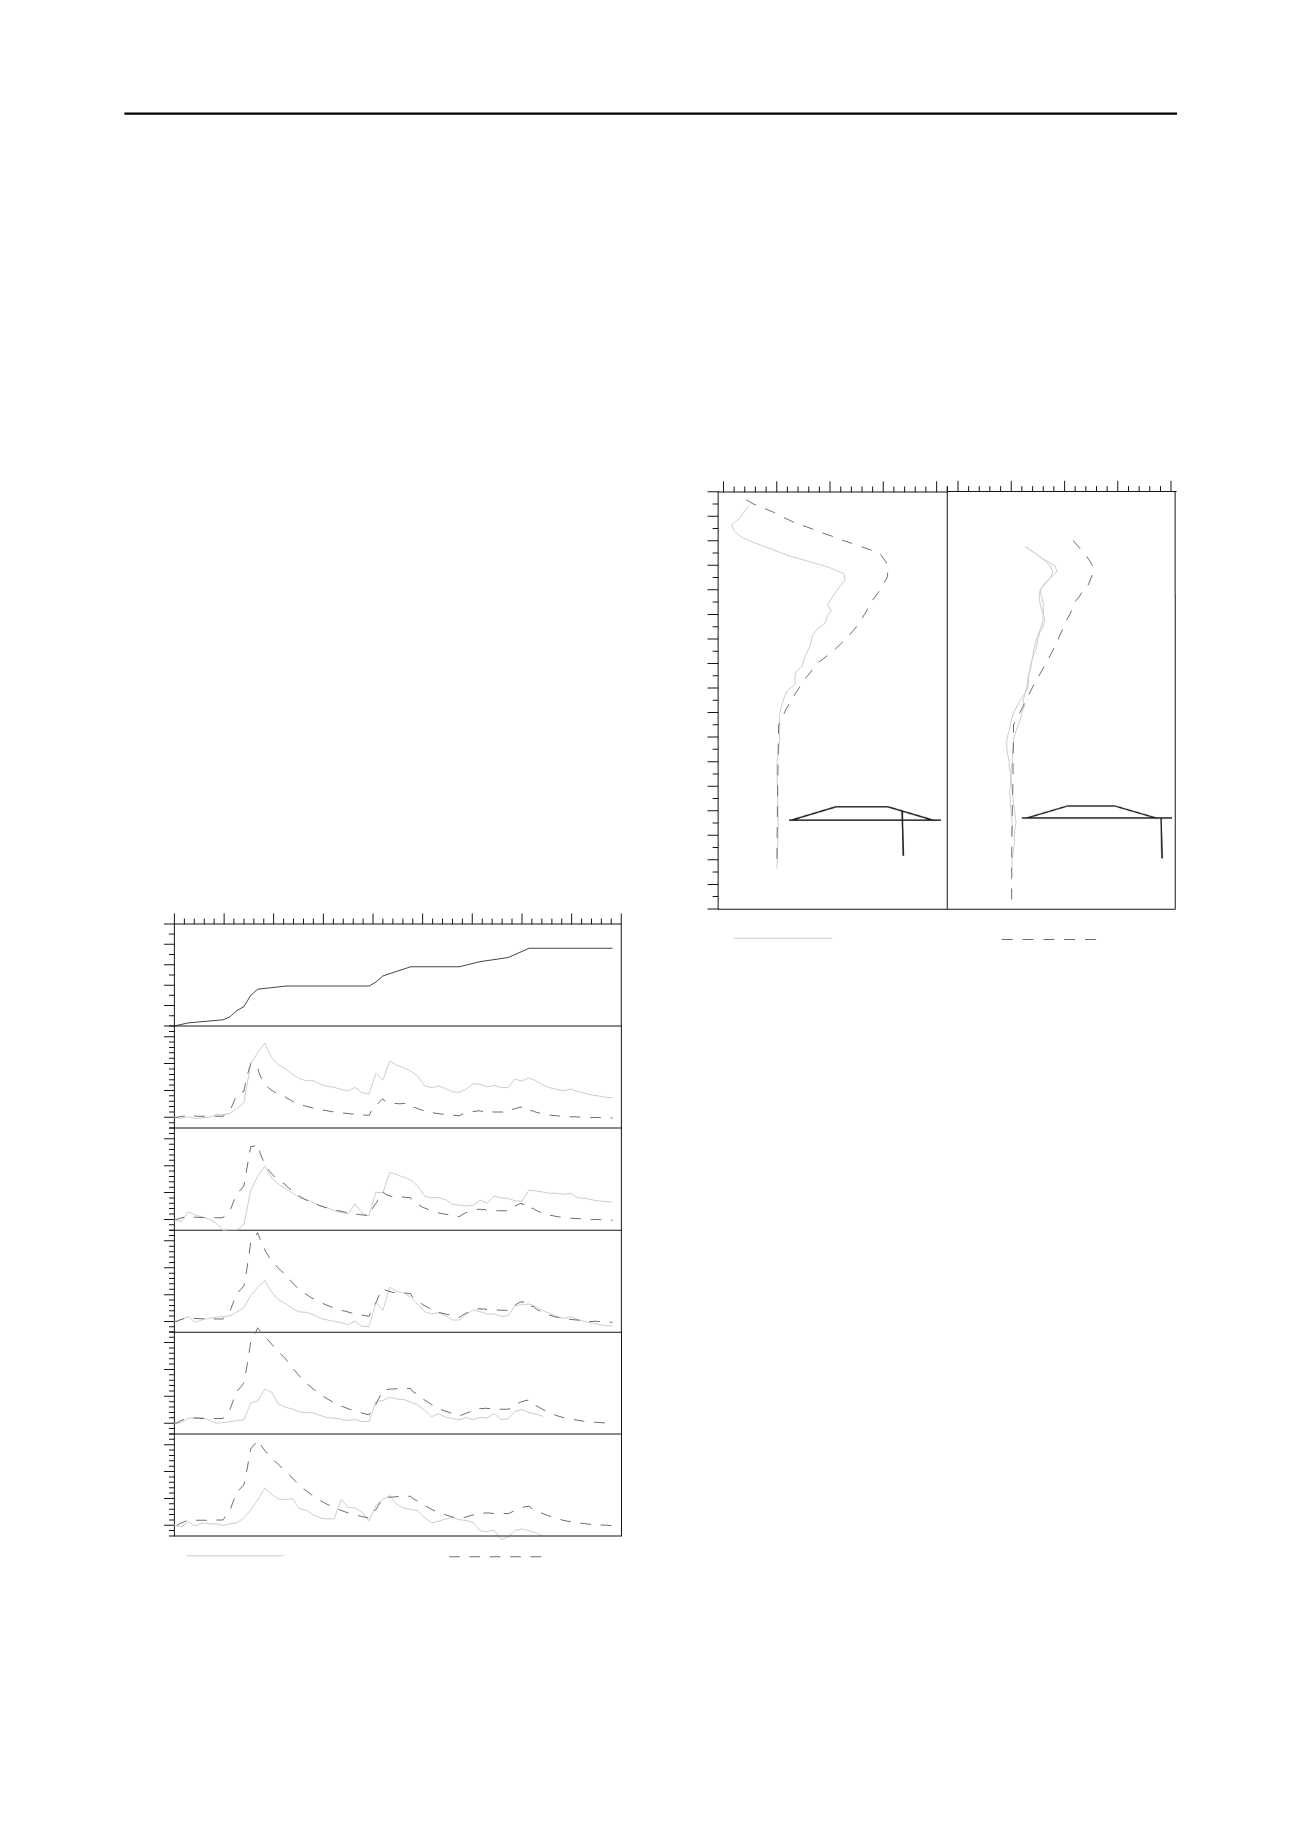
5.3
Lateral Displacement
The measured lateral displacements of the embankment and
subsoil compared with the predicted values at the end of
surcharging period are presented in
Figure 7
. As refer to Figure
3, the lateral displacement of trial embankment were monitored
by three inclinometers with two inclinometers located at the toe
of embankment and one inclinometer located at the slope of
embankment. The maximum measured lateral displacement at
the toe of embankment is 172mm at depth of 2.5m below
ground. The calculated values were over predicted by 79%
(134mm). For the lateral displacement measured at the slope,
the maximum measured lateral displacement is 258mm at depth
of 3.2m below ground. The calculated displacement was over
predicted by 62% (162mm).
-30
-28
-26
-24
-22
-20
-18
-16
-14
-12
-10
-8
-6
-4
-2
0
2
4
Depth (m)
-200
0
200
400
600
Lateral displacement (mm)
-200
0
200
400
600
Lateral displacement (mm)
At slope of embankment
At toe of embankment
Measurement
Prediction
6 CONCLUSIONS
Based on observations of the trial embankment performance and
the analyses results, the following conclusions are made:
a) The total settlement at the end of surcharge period is
about 26% of the constructed embankment height.
b) The measured settlements at original ground level were
about 1.6% to 5.7% (31mm to 88mm) more than the
calculated settlement.
c) In finite element modelling, an equivalent vertical
permeability, k
ve
, approximately represents the effect of
both the vertical permeability of natural subsoil and
radial consolidation by PVD can be adopted to simulate
the PVD behaviour.
d) Back analyses using equivalent vertical permeability
method for PVD treatment is about 5.8 times more
permeable than the original subsoil permeability.
e)
The settlement measured for the first stage filling up to
3.9m has good agreement with the settlement computed
using FEM. The settlements measured and computed at
the end of surcharging period only differ by about 6%
.
7 REFERENCES
D.G.Lin, W.T.Liu and P.C.Lin. 2006. Numerical analysis of PVD
improved ground at reference section of second bangkok
international airport.
Journal of the Southeast Asian Geotechnical
Society
, 157
–
170.
Figure 7. Measured lateral displacement of embankment.
Figure 6. Measured excess pore pressure of embankment at depth
of 2m, 3m, 4m, 8m and 10m.


