2983
Technical Committee 214 /
Comité technique 214
this reason, we conducted simulations based on a range of
assumed initial conditions and determined the initial conditions
that best reproduced the measured settlement. With regard to the
permeability coefficient
k
, given the high compressibility of the
peat layers, we assumed that the void ratio e was related to
k
by
the expression e=
C
ln
k
/
k
0
+e
0
and, for the other layers, we
assumed a constant permeability coefficient. In addition, in
order to represent the improvement by SD, we assigned a 100-
fold greater permeability to finite elements corresponding to the
SD area.
3 PREDICTION OF FUTURE SETTLEMENT BEHAVIOR
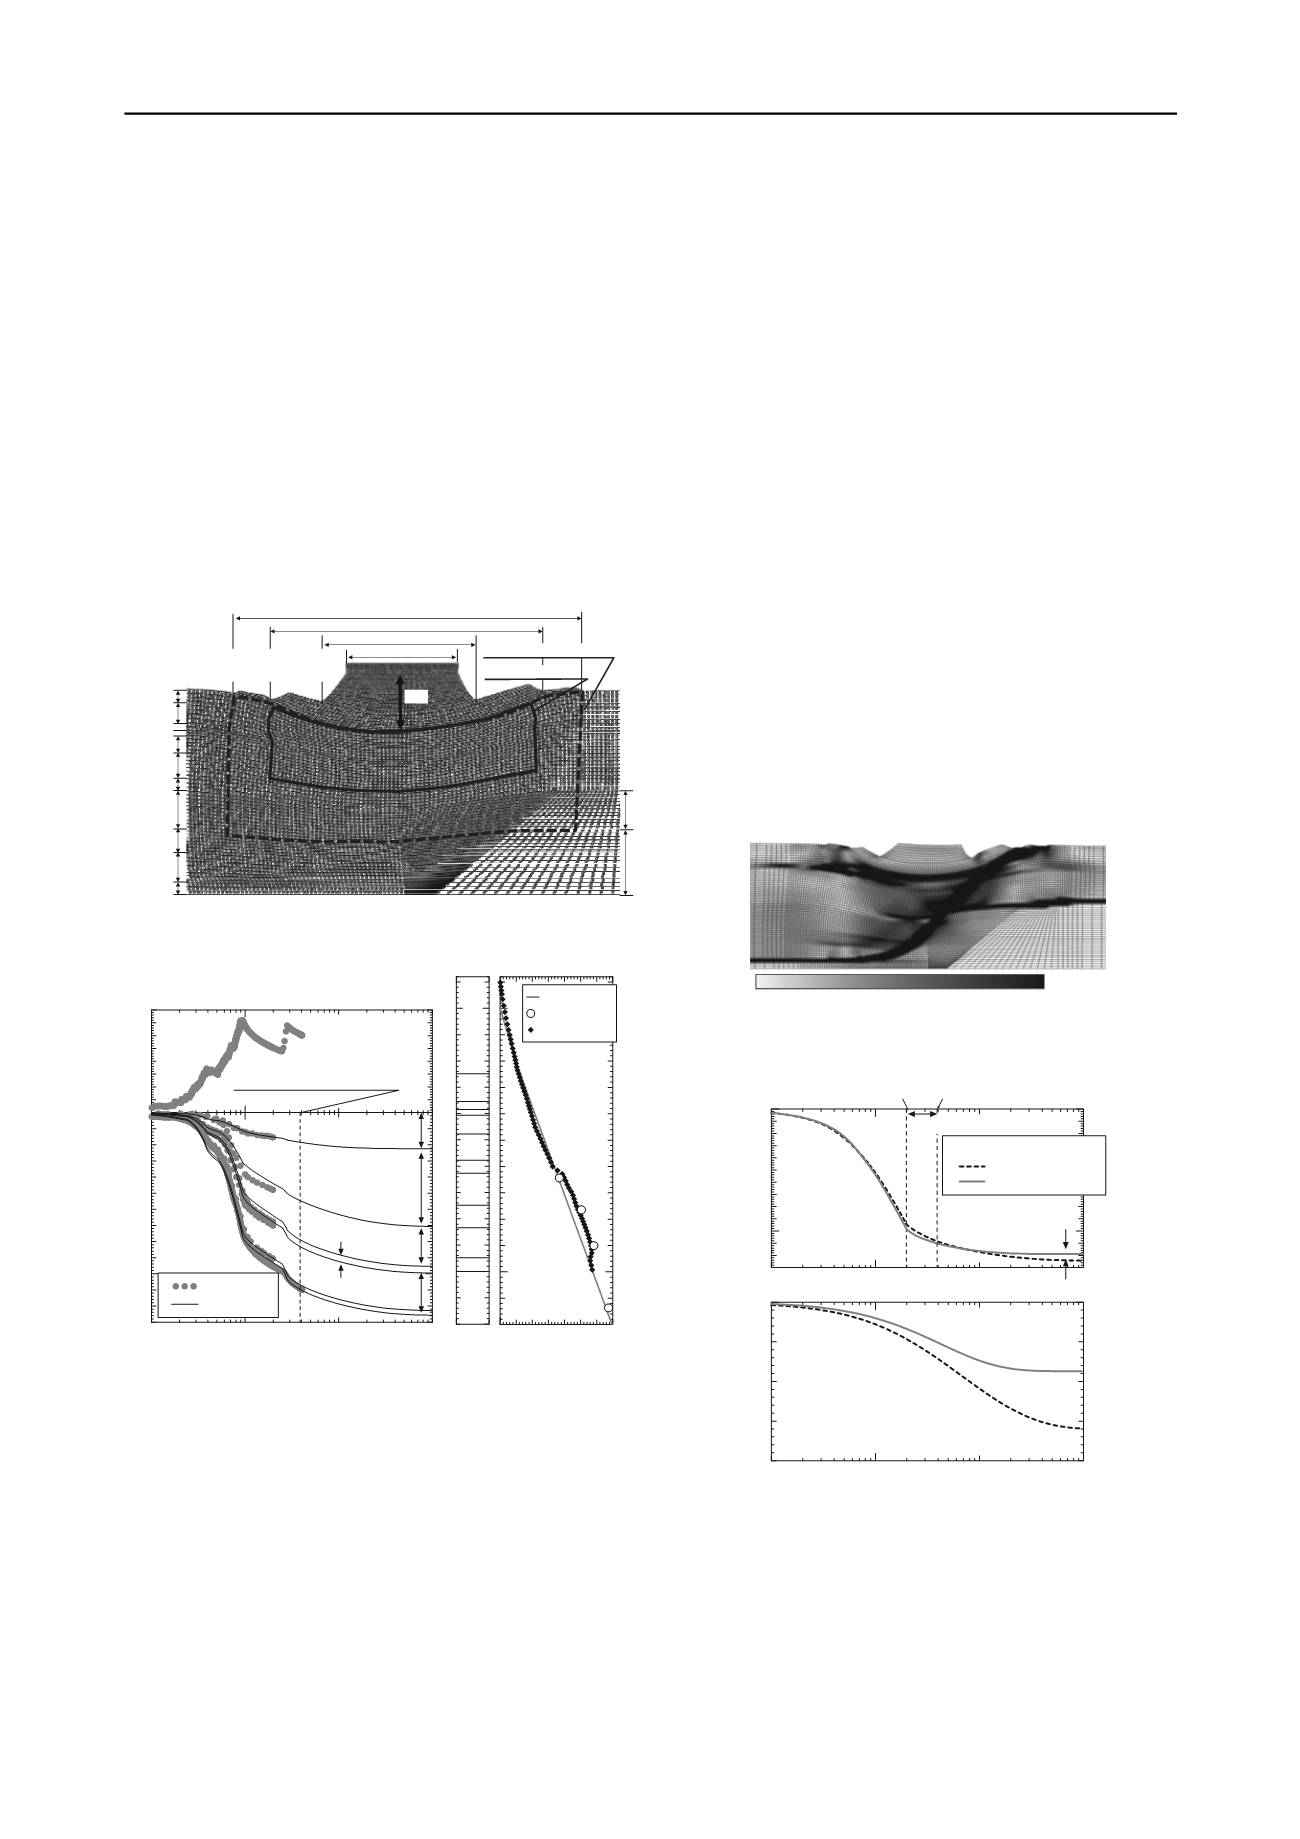
The finite element mesh and boundary conditions are presented
in Figure 4. For simplicity, in this analysis, the SD section of
Figure 1 was modeled assuming ground stratification.
Apt5 (9.5)
Apt7 (7.25)
Apt6 (5.75)
Apt8 (3.0)
Ac1-1 (3.0)
Ac1-2 (5.0)
Ac2u(4.2)
Apt3(6.2)
Ac2 (3.0)
Apt2(1.8)
As1(1.2)
Left, right and bottom faces: permeable boundary (assuming artesian conditions)
Units(m)
7.4m
27.3
39.0
As4
(9.5)
Dpt
(16.0)
SD (20m
×
60m)
68.6
85.0
Surface of ground and embankment
: permeable boundary (atmosphere)
SD expansion
(
34m
×
85m)
*Actual mesh width was 200m
Figure 4. Finite element mesh (after embankment construction).
10
-1
10
0
10
1
10
2
13
12
11
10
9
8
7
6
5
4
3
2
1
0
1
2
3
4
5
6
7
8
Time (years)
Settlement (m)
Embankment height (m)
Measurement of pore pressure
Apt8
Apt7
Apt6
Apt5
Ac2
Apt3
Ac2u
Ac1-2
Ac1-1
As1
Apt2
Measurement
Simulation
60
55
50
45
40
35
30
25
20
15
10
5
0
-5
0 200 400 600
Dg
Embankment
Simulation
Measurement
Initial condition
Pore water pressure
u
(kPa)
Depth (m)
Ac1
Apt8
Apt7
Apt6
Apt5
Ac2
Apt3
Ac2u
Apt2
As1
(a)Prediction of future settlement (b)Distribution of pore pressure
Figure 5. Simulation results (directly below the embankment center).
Figure 5(a) shows the predicted settlements at ground surface
and for all layers directly below the center of the embankment.
After adjusting the initial conditions and permeability
coefficients to reproduce the observed settlement values, the
simulation was allowed to continue to predict future settlement
behavior. According to this analysis, additional residual
settlement on the order of 1.5 m is expected to occur over the
next 70 years. Figure 5(b) shows a comparison of the measured
and simulated pore water pressure approximately 1,400 days
after the entry of embankment loading (dotted line in Figure
5(a)). It can be seen that the simulation closely reproduces the
distribution of excess pore pressure. Although the initial high
void ratio for the deep peat layers experiences an rapid
compression as a result of embankment loading, after a certain
degree of volume compression has occurred, the layers then
exhibit extremely poor permeability and have trouble
dissipating excess pore pressure. Consequently, large settlement
continues over a long term in these layers.
4 COUNTERMEASURES FOR SOFT PEAT GROUND
4.1
Effect of ground improvement using SD method
We evaluated the effect of SD on the test embankment ground
by simulating the following three cases:
Case 1: Simulating the actual SD-improved area of the test
embankment (20 × 60m (L ×W))
Case 2: No SD-improvement
Case 3: Expanding the SD-improved area in accordance with
specific site conditions. (34 × 85 m (L × W), i.e., the entire area
directly under the embankment down to the Apt5 layer)
In each case, based on actual records at the construction site, the
simplest construction history was used (constant increasing the
embankment thickness at a rate of 2.35 cm/day).
Although the magnitude of the settlement during initial
embankment construction is lowest in Case 2, it was shown that
because the poor permeability induces shear deformation under
undrained condition, large-scale circular slip extends to the deep
ground layers below the embankment center (Figure 6). From
this result, it appears that ground improvement using SD in this
area was effective in preventing catastrophic slip failure.
0
10
20
over 30(%)
Figure 6 Circular slip during loading (Case 2: No SD-improvement)
10
-1
10
0
10
1
10
2
13
12
11
10
9
8
7
6
5
4
3
2
1
0
10
-1
10
0
10
1
10
2
2
1.5
1
0.5
0
Time (years)
Settlement (m)
End of loading
Case 1: 20
×
60m
Start of
resifural settlement measurement
2 years
=55cm
Difference of
total settlement
Residual settlement (m)
87cm
159cm
Time since start of residual settlement measurements (years)
Case 3: 34
×
85m
SD-improved area (L
×
W)
Figure 7 Comparison of SD-improvement area.
Case 3 resulted in stability, particularly of the deep peat layers,
and early settlement convergence. Figure 7 shows the settlement
for Cases 1 and 3. The residual settlement starting at a point 2
years (assuming the entry into service) after embankment
construction is also illustrated in the lower panel. Expansion of
the SD-improved area, particularly in the deep peat layers,
reduces lateral displacement due to undrained shear deformation
and settlement associated therewith. The total settlement is
reduced by 55 cm across the entire area of ground under the


