2975
Technical Committee 214 /
Comité technique 214
displacements up to 40 cm at the top of the pile before
superstructure was placed. Measurements in the phase of test
load have shown minimum displacements, which are within the
limits of elastic deformation of concrete.
Cu=20-40kPa
Cu=40-80kPa
c=10kPa
=28°
c=0 kPa
=40°
SFs/ML
CL/CH
ML/SFs
G
CL/CH
STORAGE AREA
STONE COLUMNS 2x2m
STONE COLUMNS 2.8x2.8m
COASTAL
CONSTRUCTION
+3,0
-8,0
-20,0
-15,0
D
B A
C
c=0 kPa
=30°
-8 m a.s.l.
-20 m a.s.l.
-33 m a.s.l.
-42 m a.s.l.
-52 m a.s.l.
Figure 7 Construction phase IV: construction of coastal structure over
piles.
Cu=20-40kPa
Cu=40-80kPa
c=10 kPa
=28°
c=0kPa
=40°
SFs/ML
CL/CH
ML/SFs
G
CL/CH
STORAGE AREA
STONE COLUMNS 2x2m
STONE COLUMNS 2.8x2.8m
COASTAL
CONSTRUCTION
-8,0
-20,0
-15,0
D
B A
C
SHIP 60000DWT-a
c=0 kPa
=30°
-8 m a.s.l.
-20 m a.s.l.
-33 m a.s.l.
-42 m a.s.l.
-52 m a.s.l.
Figure 8 Use of container terminal.
4 BACK ANALYSES
Design and monitoring during construction by means of back
analyses based on data obtained by measurements were carried
out by the same design team. The design team was made up of
designers of the coastal structure and geotechnical engineers.
Soil-structure interaction was taken into account through
cooperation of design teams in the design process and
construction.
Based on measured data on soil settlement and pile
displacement back analyses were performed. The objective of
back analyses was to establish “actual” soil parameters and
internal forces in the structure.
Two models were made for the implementation of back
analyses. Inclinometer and deformeter measurements on storage
areas through back analyses were processed in Model 1.
Material parameters used in Model 2 were obtained on Model 1
based on actual displacements. In Model 2, analysis of pile
displacements during terminal construction (up to phase III) was
performed, as well as the comparison with measured
displacements. Internal forces in piles were calculated on the
model calibrated in this manner.
Since the measurements after execution of superstructure on
piles and during test loading showed minimum displacements
within the limits of elastic deformation of concrete, these
construction phases will not be discussed in this paper.
Model 1 was made in Settle 3D software. The soil was set as a
linear material through the coefficient of compressibility and
vertical consolidation coefficient, and the parameters obtained
by back analyses are shown in Table 1. A soil profile was made
by means of deformeter measurements, which approximately
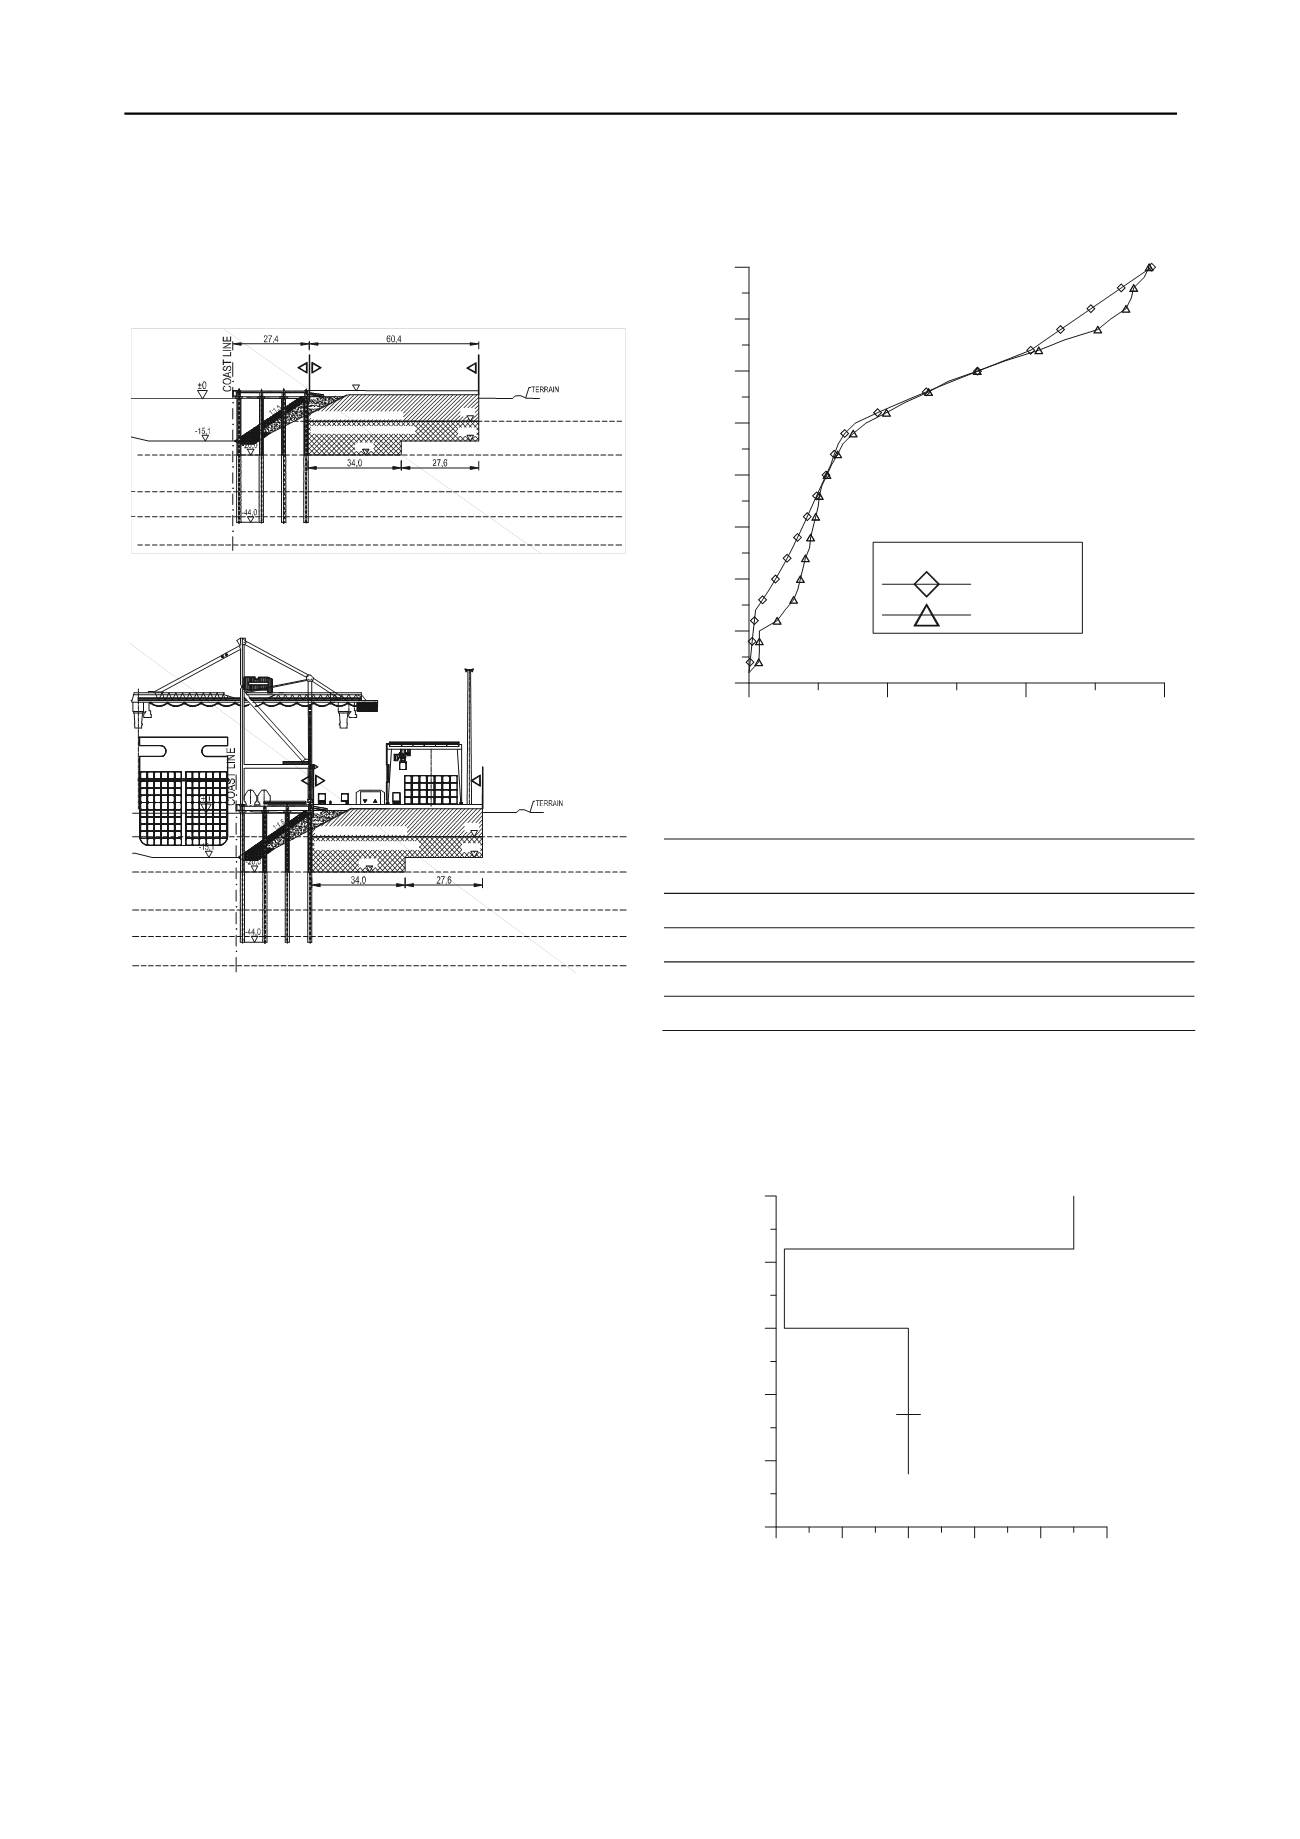
describes the actual condition in the soil. Figure 9 shows the
settlement curve from the vertical deformeter and the curve
obtained through back analyses. The curves show soil
settlement by layers after 90-day preloading period.
0
200
400
600
Shortening (mm)
40
35
30
25
20
15
10
5
0
Elevation [m a.s.l.]
LEGEND
back analysis
deformeter
Figure 9 Soil settlement by layers in vertical deformeter, and according
to back analyses after 90 days of preloading.
Table 1.Modules of compressibility and vertical consolidation
oefficients for back analysis in Model 1.
c
Parameter /
Soil
Elev. [m]
Ms [MPa]
Cv [m
2
/s]
Ch / Cv
SFs / ML
0 -8
4.5
1.15*10
-5
4
CL / CH
8 -15
2.5
3.5*10
-7
2
CL / CH
20 – 33
5
8.1*10
-6
-
ML / SFs
33 - 39
30
1.5*10
-5
-
Figure 10 shows the ratios of modules of compressibility
assumed in the design and those obtained by back analysis. For
design values, the improvement of compressibility parameters
due to soil improvement by stone columns was not taken into
consideration. The scope of ratios ranges from 0.625 to 1.5.
SFs / ML
CL / CH
0.6
0.8
1
1.2
1.4
1.6
Ms back analysis / Ms design
50
40
30
20
10
0
Elevation [m a.s.l.]
CL / CH
ML / SFs
Figure 10 Ratios of modules of compressibility according to back
analyses and design values.
Thus in parts where vibrated stone columns are placed in a
triangular grid 2x2m, the value of soil improvement factors of
1.5 was obtained, which falls within the design assumptions. It
is interesting to consider the ratio that was lower than 1, which


