2982
Proceedings of the 18
th
International Conference on Soil Mechanics and Geotechnical Engineering, Paris 2013
card-board drain (CBD) method, the sand drain (SD) method, or
no improvement, with the aim to select a countermeasure for
soft ground. Among these, the soft ground layer was thickest
directly under the test embankment established using the SD
method. When taking into consideration the settlement of all
layers up to the deep peat layers, the total settlement, estimated
prior to embankment construction, was 8.6 m. In practical terms,
however, as presented in Figure 5, this meant that in order to
achieve the planned embankment height of 7 m, the
embankment had to be 15 m (embankment height + settlement)
thick.
The large-scale settlement has been accompanied by substantial
changes in an extensive area surrounding the embankment.
Ground upheaval of up to 1 m and lateral displacement of up to
2 m have been observed in the vicinity of the toe of the slope.
The surrounding ground has also experienced an inclination of
waterways and cracking of the soil surface. At this point, 4
years after the establishment of the test embankment, settlement
has reached 11 m, representing a settlement rate of 3.0
cm/month with little sign of convergence.
1 PREVIOUS RESEARCH
The long-term settlement that accompanies embankment
loading is referred to as “delayed compression” or “secondary
consolidation” and is a problem frequently encountered in
sensitive naturally-deposited clay. For example, according to
the construction records of the former Japan Highways Public
Corporation, approximately 20% of embankments on soft
ground in Japan have experienced 1 m or more of residual
settlement after entry into service, which has necessitated
substantial sums of money and labor for maintenance and repair
including the expansion of road shoulders and rectification of
level differences. However, we know from experience that
settlement predictions based on Terzaghi’s Theory of
Consolidations (Terzaghi 1943) and observational methods such
as the Asaoka method (Asaoka 1978) tend to underestimate the
magnitude and time span of settlement in such sites.
Meanwhile, because settlement estimates based on visco-plastic
theory (e.g. Šuklje 1957) assume perpetual delayed
compression, it is difficult to explain why and under what
conditions delayed compression occurs and the efficacy of
particular countermeasures.
Mounting the SYS Cam-clay model as an elasto-plastic
constitutive equation for the soil skeleton structure into the soil-
water coupled finite deformation analysis program
GEOASIA
,
we have explained the mechanism of delayed compression as a
consolidation phenomenon accompanied by plastic compression
due to progressive failure of the soil skeleton structure (Noda et
al. 2005). While, we have also proposed a simple method for
assessing the risk of delayed compression based on a laboratory
mechanical test and a novel method for predicting long-term
settlement accompanied by delayed compression (Inagaki et al.
2010a). In addition, we have applied these methods to the
analysis of embankment loading sites built on soft clay ground
that has actually experienced long-term settlement (Tashiro et
al. 2011).
The elasto-plastic constitutive SYS Cam-clay model that serves
as the basis for the above simulations enables the wide range of
soil components, from sand to clay, to be treated within the
same theoretical framework. Furthermore, the
GEOASIA
analysis program into which the model is integrated, enables all
manner of mechanical conditions, including ground
consolidation, deformation, stability and failure to be analyzed
in series. In this paper, we apply the various insights gained
from soft clay ground to peat ground and attempt to describe,
predict, and evaluate countermeasures related to large-scale
settlement behavior.
2 DEDUCTION OF INITIAL GROUND CONDITIONS
Prior to conducting the simulation, in order to estimate the
initial ground conditions, we examined historical data related to
ground formation as well as various survey data, including pore
water pressure. The area is located between faults, and it is
believed that the soil was deposited through the repeated
upheaval, settlement, and deep sediment of organic components
in a valley that experienced continuous artesian conditions. In
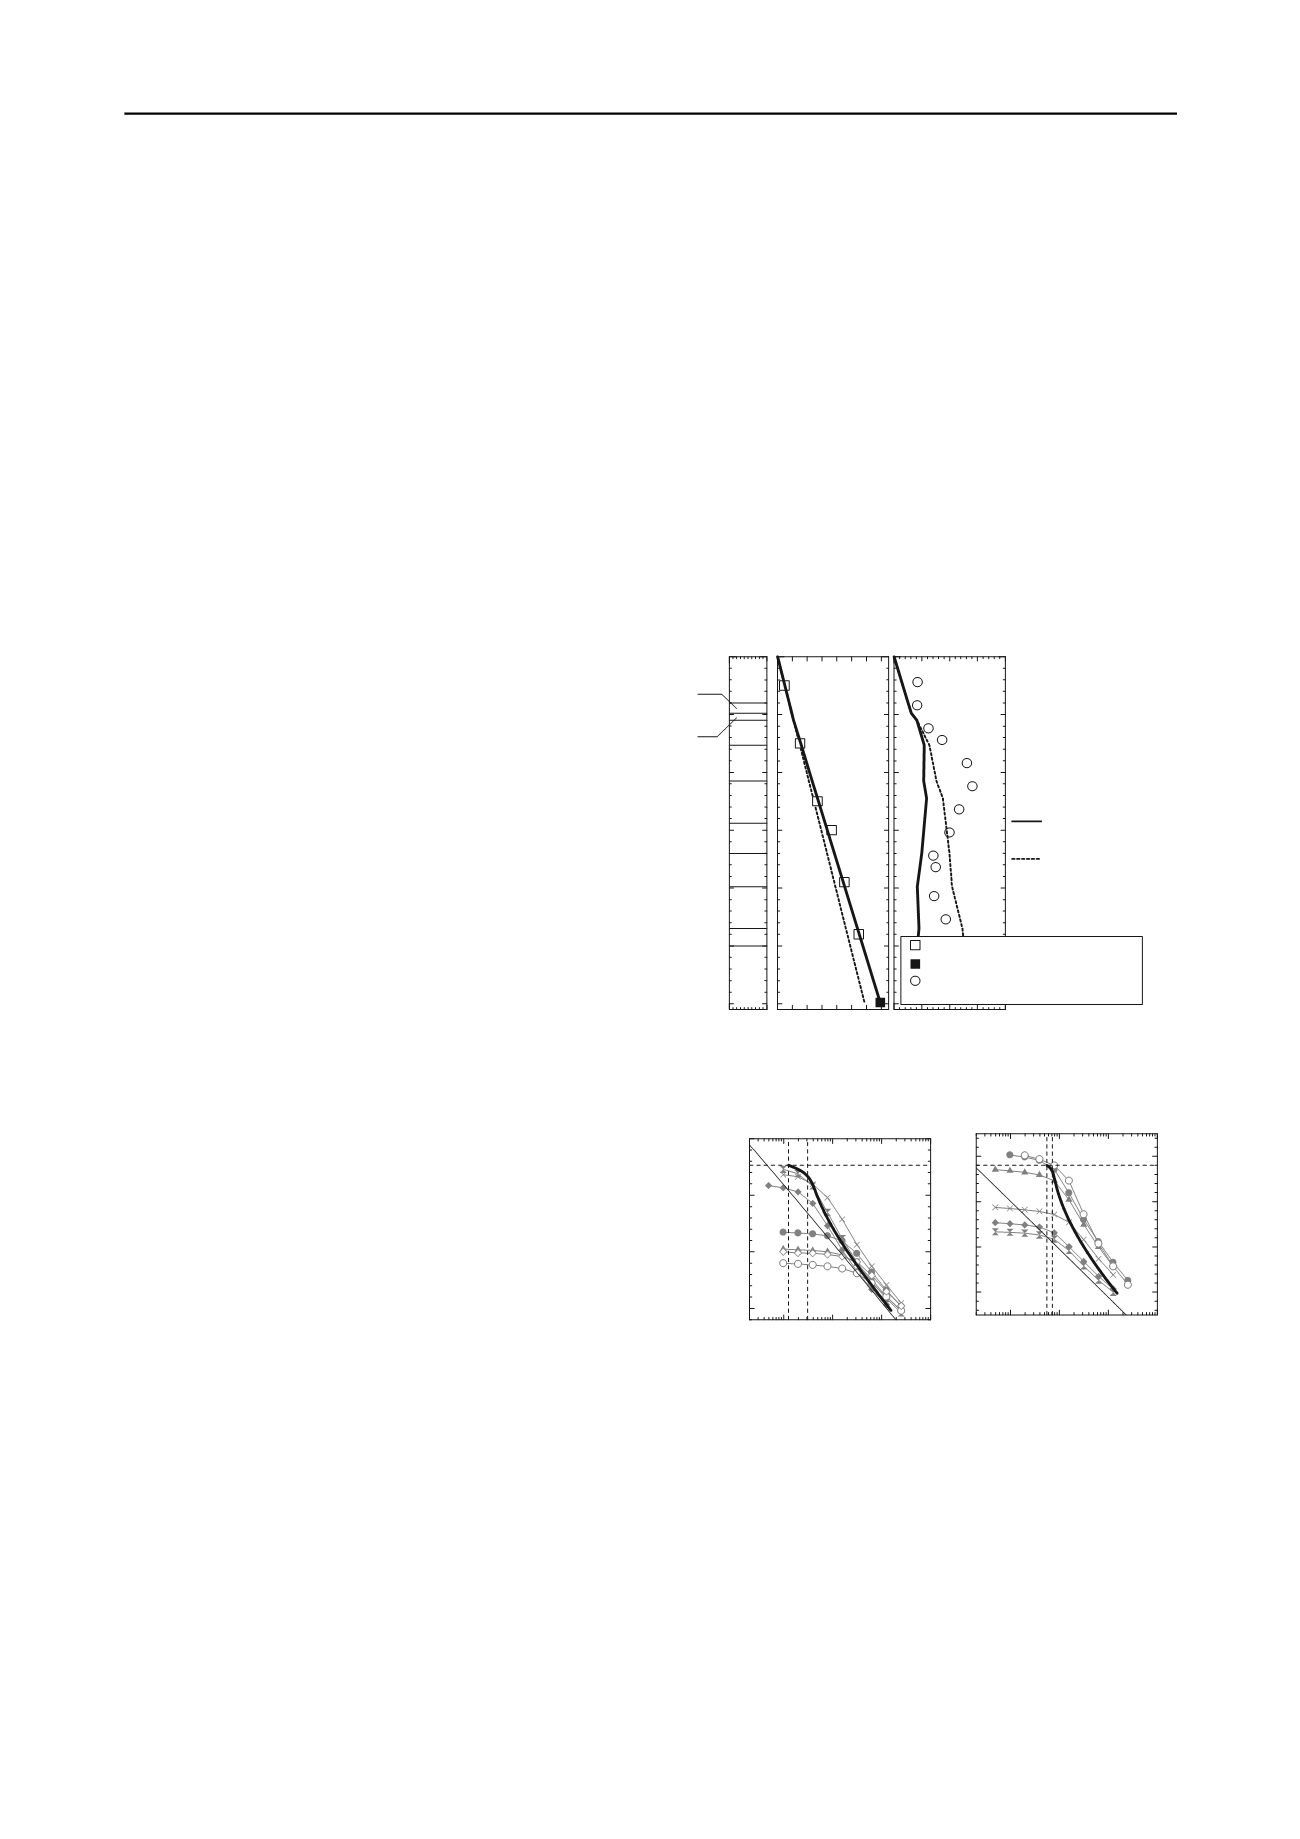
this paper, the initial distribution of pore water pressure and
effective overburden pressure of the ground prior to
embankment loading is estimated in Figure 2. For reference, the
distribution when artesian pressure is not taken into
consideration is included as a dotted line. This represents an
unusual case in which the initial effective overburden pressure
p
0
becomes greater than the consolidation yield stress
p
c
(
p
0
>
p
c
). In this region, it is expected that the increase in artesian
pressure accompanying the increase in soft ground thickness
resulted in a continuous low effective pressure in the deep
ground.
0 200 400 600 0
100
200
60
50
40
30
20
10
0
Depth (m)
Pore pressure (kPa)
: Measured value (before embankment)
Effective overburden (kPa)
: Consolidation yield stress
p
c
(before embankment)
Ac1
Dg
Apt8
Apt7
Apt6
Apt5
Ac2
Apt3
Ac2u
Apt2
As1
: Measured value (after embankment)
: Artesian pressure
is not considerd
: Artesian pressure
is considerd
Figure 2. Estimated distribution of initial pore water pressure and
effective overburden pressure
10
1
10
2
10
3
10
4
2
3
4
5
Specific volume v
Vertical effective stress
'
v
(kPa)
Ac1-2
'
v0
pc
v
0
10
1
10
2
10
3
10
4
2
3
4
5
Specific volume v
Vertical effective stress
'
v
(kPa)
Apt7
'
v0
pc
v
0
Figure 3. Examples of compression curves for undisturbed samples
(gray lines) and estimated compression curves for in-situ soil (thick
black lines).
Next, through laboratory tests, we attempted to determine the
material constants and initial conditions. As presented in Figure
3, based on previous research on naturally deposited clay
(Inagaki et al. 2010), we estimated compression curves for in-
situ soil from the compression curves for undisturbed samples,
taking into consideration the various “disturbances” that might
occur during sampling, removal from the sampling tube,
specimen preparation and setting-up on the testing machine.
However, we observed considerable heterogeneity among
samples from the deep peat layers with regard to factors such as
mixing of plant fibers. In addition, it was expected that these
samples were substantially impacted by “disturbances,” given
their poor strength resulting from their high water content. For


