2978
Proceedings of the 18
th
International Conference on Soil Mechanics and Geotechnical Engineering, Paris 2013
Proceedings of the 18
th
International Conference on Soil Mechanics and Geotechnical Engineering, Paris 2013
10 15 20
kN/m
3
14
13
12
11
10
9
8
7
6
5
4
3
2
1
0
Depth (m)
Bulk Density
0.1 0.2 0.3
Compression
Ratio (CR)
0 0.02 0.04
Re-compression
Ratio (RR)
0 2 4 6 8 10
----- Piezocone
Over Consolidation
Ratio (OCR)
0 40 80 120
kPa
Preconsolidation
Pressure (PC)
0 10 20 30 40
kPa
M - Undisturbed
=- Remoulded
Undrained Shear
Strength (Su)
0 40 80 120 160
%
{ - Plastic Limit
Y- Water Content
y - Liquid Limit
Atterberg Limit with
Water Content
CR = Cc / 1+e o RR = C r / 1+e o
adopted to simulate the behaviour of the soft clay under loading
condition and coupled consolidation process for each stage of
construction. Stress dependent stiffness (logarithmic
compression behaviour) between volumetric strain and mean
effective stress is assumed in SSM. Distinction between primary
loading and unloading-reloading stiffness based on the modified
index λ*
(
CR/2.3) and κ*
(2RR/2.3) were obtained from 1D
Oedometers tests. In addition, SSM is able to memorise the pre-
consolidation stress with OCR input in the initial stage. Whilst,
Hardening Soil Model (HSM) was utilised to model the
underlying silty sand layer and the fill materials.
From a macro point of view, PVD increases the subsoil
mass permeability in vertical direction (Lin et al, 2006).
Therefore, an equivalent vertical permeability, k
ve
,
approximately represents the effect of both the vertical
permeability of natural subsoil and radial consolidation by PVD
was established to simulate the PVD behaviour in the back
analyses. Based on the back analyses results, k
ve
is about 5.8
times more permeable than the vertical permeability of the
original subsoil (soft clay). The geometry of FEM is shown in
Figure 4.
5 MEASUREMENT VERSUS CALCULATION
5.1
Settlement
The calculated results of the FEM analyses are compared with
the measured settlement.
Figure 5
shows the settlement profile
of the embankment at the centre and the edge versus
embankment filling time. The measured settlements at the end
of surcharging period are averagely 1963mm and 1545mm at
the centre and edge of the embankment respectively. This
correspondences to 26% and 20% of the total constructed
embankment height. The calculated settlement at the centre of
embankment is 1932mm which is 31mm or 1.6% lower than the
measured value. In general, the back-calculated settlement
profile is fairly close to the measured settlement profile
especially during first stage of filling (within 200 days) up to a
fill thickness of 3.9m.
Depth
Soil type SPT'N
γbulk
(kN/m3)
c' (kPa)
' (
)
CR
RR OCR su (kPa)
0m to 5m CLAY 0 - 1
13
5
21
0.25
0.03 3.0 - 4.4
15 - 25
5m to 10m CLAY 0 - 1
13
5
21
0.22
0.027 1.7 - 2.7
25 - 35
10m t o15m CLAY 1 - 4
16.5
5
21
0.12
0.017
1.2
30 - 35
15m to 24m silty SAND 12 - 21
18
5
30
24m to 30m silty SAND > 50
18
Figure 2. Subsoil properties.
Table 1. Interpreted subsoil parameters.
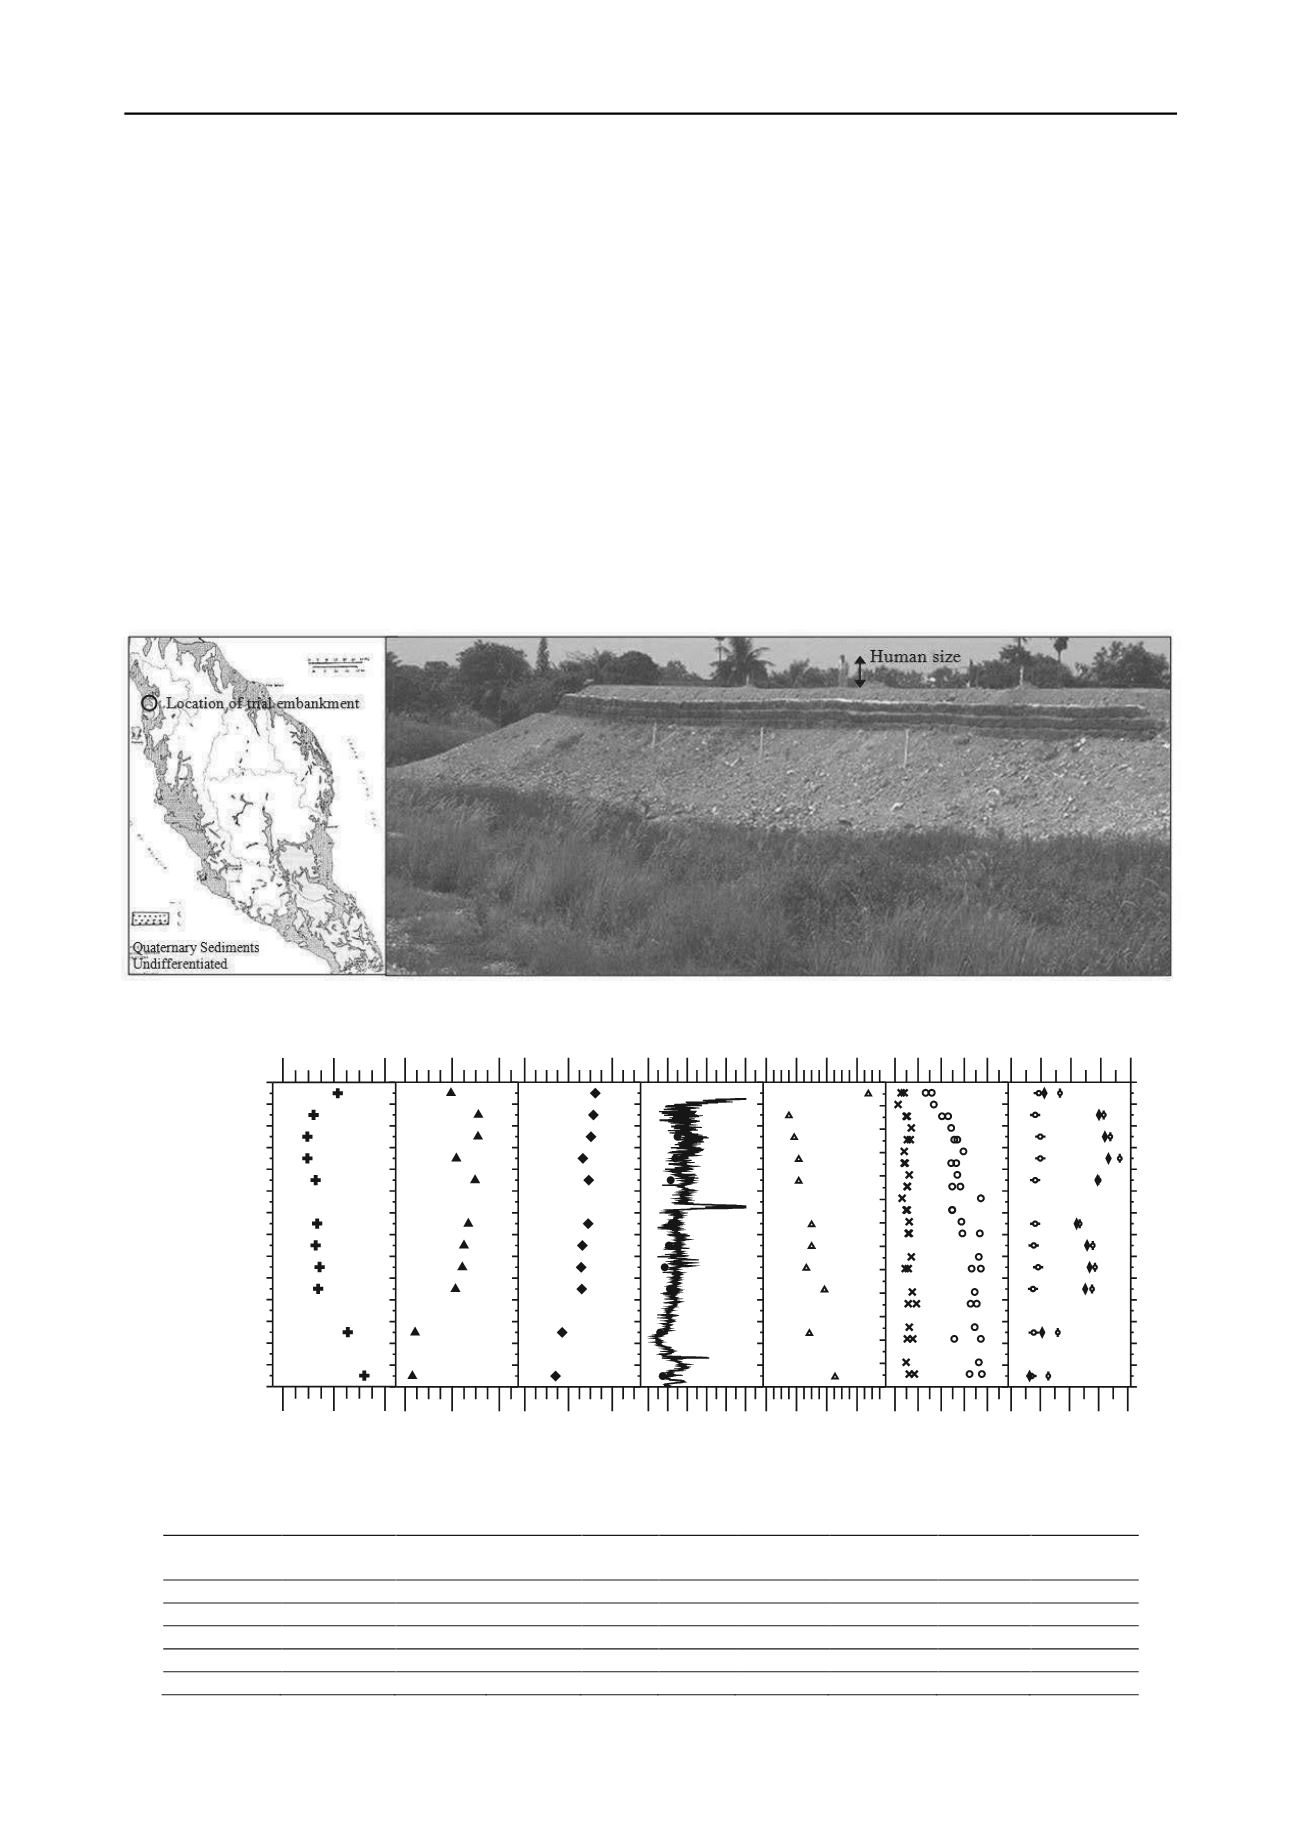
Figure 1. Location and overview of trial embankment.


