98
Proceedings of the 18
th
International Conference on Soil Mechanics and Geotechnical Engineering, Paris 2013
Proceedings of the 18
th
International Conference on Soil Mechanics and Geotechnical Engineering, Paris 2013
Within the range of interest (w/D ~ 0.2 to 0.5), this may be
approximated by a linear ‘plastic’ spring of stiffness
D4~
w
V k
vp
(32)
In addition to the ‘geotechnical resistance’ given by the
above relationships, allowance must be made for buoyancy
effects as the pipeline becomes embedded within the soil
(Merifield et al. 2009). This adds a component of resistance that
effectively increases the shear strength gradient by a factor that
is of the order of 1 + f
'/
, with f ~ 0.15 to 0.25 depending on
the embedment and amount of heave adjacent to the pipeline.
Under dynamic lay conditions, lateral motion of the pipe will
tend to reduce the amount of soil heave adjacent to the pipe.
The linear penetration stiffness allows the complete response
of the pipeline (or SCR) to be determined through the
touchdown zone, using analytical solutions based on a boundary
layer approach (Lenci and Callegari 2005, Palmer 2008, Yuan
et al. 2012). A characteristic length,
, reflecting the length of
the touchdown zone, emerges from the solutions and is given by
0
T
EI
(33)
where EI is the bending rigidity of the pipe and T
0
the
horizontal component of tension in the catenary (Figure 17).
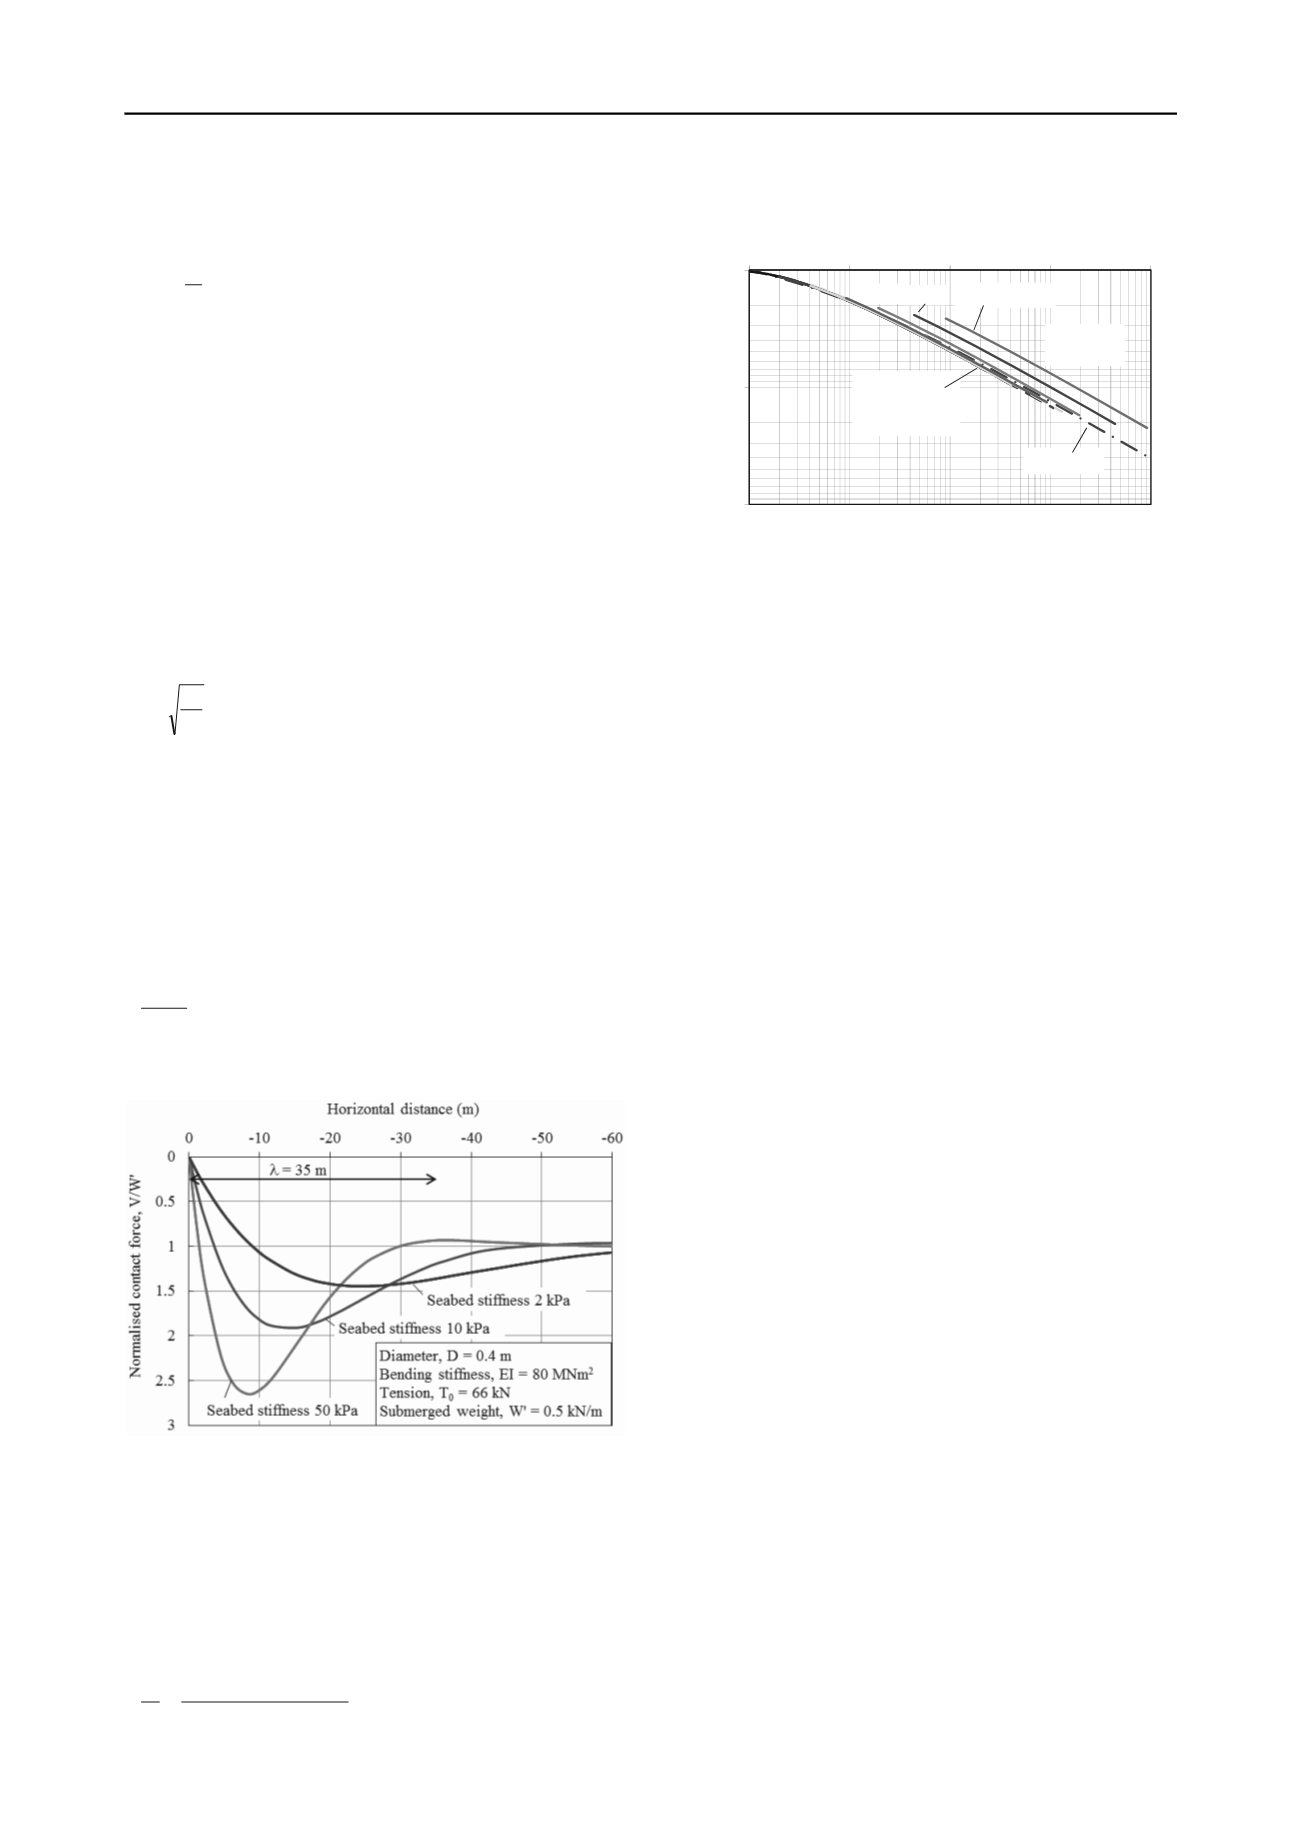
The effect of the seabed stiffness, k
vp
, on the profile of contact
force, V, through the touchdown zone is shown in Figure 18.
The maximum static contact force, V
max
, normalised by the
submerged weight of the pipe, W', is a function of the seabed
stiffness, and also of the characteristic length,
, as shown in
Figure 19. The variation of V
max
may be approximated as
(Randolph and White 2008a)
25.0
0 vp
2
max
T/ k 4.06.0~
'W
V
(34)
A typical range for V
max
/W' for deep water pipelines is 1.5 to 3,
as indicated in Figure 18.
Figure 18 Profiles of normalised contact force for different values of
seabed stiffness.
Westgate et al. (2012) suggested that, as a first
approximation, pipeline embedment under typical lay
conditions may be estimated based on the maximum static
contact force, V
max
, and assuming fully remoulded shear
strength for the soil. Combining Equations (32) and (34), but
with the shear strength gradient,
, replaced by the remoulded
strength gradient,
rem
=
/S
t
, then gives
'W
D 7
T/D
1
~
D
w
2
rem
25.0
0
rem
2
(35)
1
10
100
1
10
100
1000
10000
Maximum contact force, V
max
/W'
Normalised seabed stiffness,
(k
vp
/T
0
)
0.5
Analytical
solutions
(T
0
/
W'
10)
Curve fit
T
0
/
W'
0.1
0.3 1
OrcaFlex
results
Figure 19 Maximum static contact force in touchdown zone (Randolph
and White 2008a).
Effects of buoyancy may be incorporated by adjusting W'
iteratively, or by factoring the remoulded strength gradient by
1 + f
'/
rem
, taking f in the range 0.15 to 0.25.
The simple approach of using the remoulded shear strength
balances two compensating factors. On the one hand
assumption of fully remoulded conditions exaggerates the actual
degree of softening under typical lay conditions. This is
balanced by using the maximum static force, V
max
, to estimate
embedment, rather than the maximum dynamic force, V
dyn
,
which is typically 25 to 50 % greater than V
max
but can be even
larger in more severe sea states (Westgate et al. 2010).
A more refined treatment of pipeline embedment was
described by Westgate et al. (2013), taking account of:
The estimated number of motion cycles experienced by
each section of pipeline as it passes through the touchdown
zone.
Combined horizontal and vertical motions.
Gradual softening of the soil resulting from cumulative
displacement of the pipeline relative to the soil due to the
cyclic motions.
The approach builds on the model for cyclic degradation of the
resistance of full-flow penetrometers during penetration and
extraction cycles (Zhou and Randolph 2009b), but incorporating
a brittle ‘structured’ component of soil strength that is lost
rapidly (Randolph et al. 2007). The effect of horizontal motion
is incorporated by considering theoretical yield envelopes in
V-H space, from which an associated flow rule allows
estimation of the ratio of vertical to horizontal movements
(Cheuk and White 2011).
Although built on reasonable theory, the model incorporates
empirical adjustment factors, which were calibrated through
centrifuge model tests. The model was then applied to three
sites where field data were available from post-installation
surveys, in addition to video footage during the lay process that
allowed estimation of the amplitude of horizontal pipe motions.
The observed pipeline embedment was found to lie within the
range predicted for ‘light’, ‘moderate’ and ‘severe’ sea states
(Figure 20).
Direct application of Equation (35), factoring the remoulded
shear strength gradient, leads to estimated embedment, w/D, in
the range 0.28 to 0.33, which is consistent with the most
frequently observed values. However, it is evident from Figure
20, and other field cases reported by Westgate et al. (2013), that
the pipeline embedment should be considered as a non-
deterministic quantity, varying with lay conditions even if the
seabed properties are relatively uniform along the pipeline
route. This is consistent with modern probabilistic design
approaches for pipelines (White and Cathie 2010). The detailed
treatment for estimating pipeline embedment proposed by
Westgate et al. (2013) allows probabilistic distributions of
pipeline embedment to be derived in a logical manner.


