94
Proceedings of the 18
th
International Conference on Soil Mechanics and Geotechnical Engineering, Paris 2013
Proceedings of the 18
th
International Conference on Soil Mechanics and Geotechnical Engineering, Paris 2013
The form of failure envelope adopted by Bransby and
O’Neill (1999) was based on that suggested by Murff (1994):
0 1
s m n
p/1 t
r
q
(24)
where n, m and s represent the mobilisation ratios
(e.g. n = N/N
u
) for normal, moment and sliding modes relative
to the anchor fluke. Ultimate, uniaxial, limits, N
u
, M
u
and S
u
are
typically obtained from a combination of plasticity solutions
and finite element analysis, depending on the anchor fluke
shape (O’Neill et al. 2003, Aubeny and Chi 2010). Similarly,
the various powers may be adjusted to fit different anchor
shapes, with q and t typically in the range 3 to 5, and p, r around
unity (Bransby and O’Neill 1999, Elkhatib 2006, Yang et al.
2010). The values of q, r and t should not be chosen less than p,
in order to guarantee convexity of the failure envelope.
A similar approach was adopted to model the keying of
mandrel-installed plate anchors, such as the suction embedded
plate anchor or SEPLA (Cassidy et al. 2012, Yang et al. 2012).
Combining the chain response with the failure envelope allows
the full kinematic response of the plate anchor to be
investigated. The position of the padeye relative to the plate
centre may then be optimised, minimising loss of embedment
during keying or even such as to cause the anchor to dive. A
careful finite element based parametric study showed that the
original SEPLA design, which incorporated a hinged flap to
help limit loss of embedment during keying, was ill conceived
(Tian et al. 2013). More recent numerical work has considered
sophisticated 3D anchor geometries, investigating how the
presence of the shank affects the failure envelope (Wei et al.
2013).
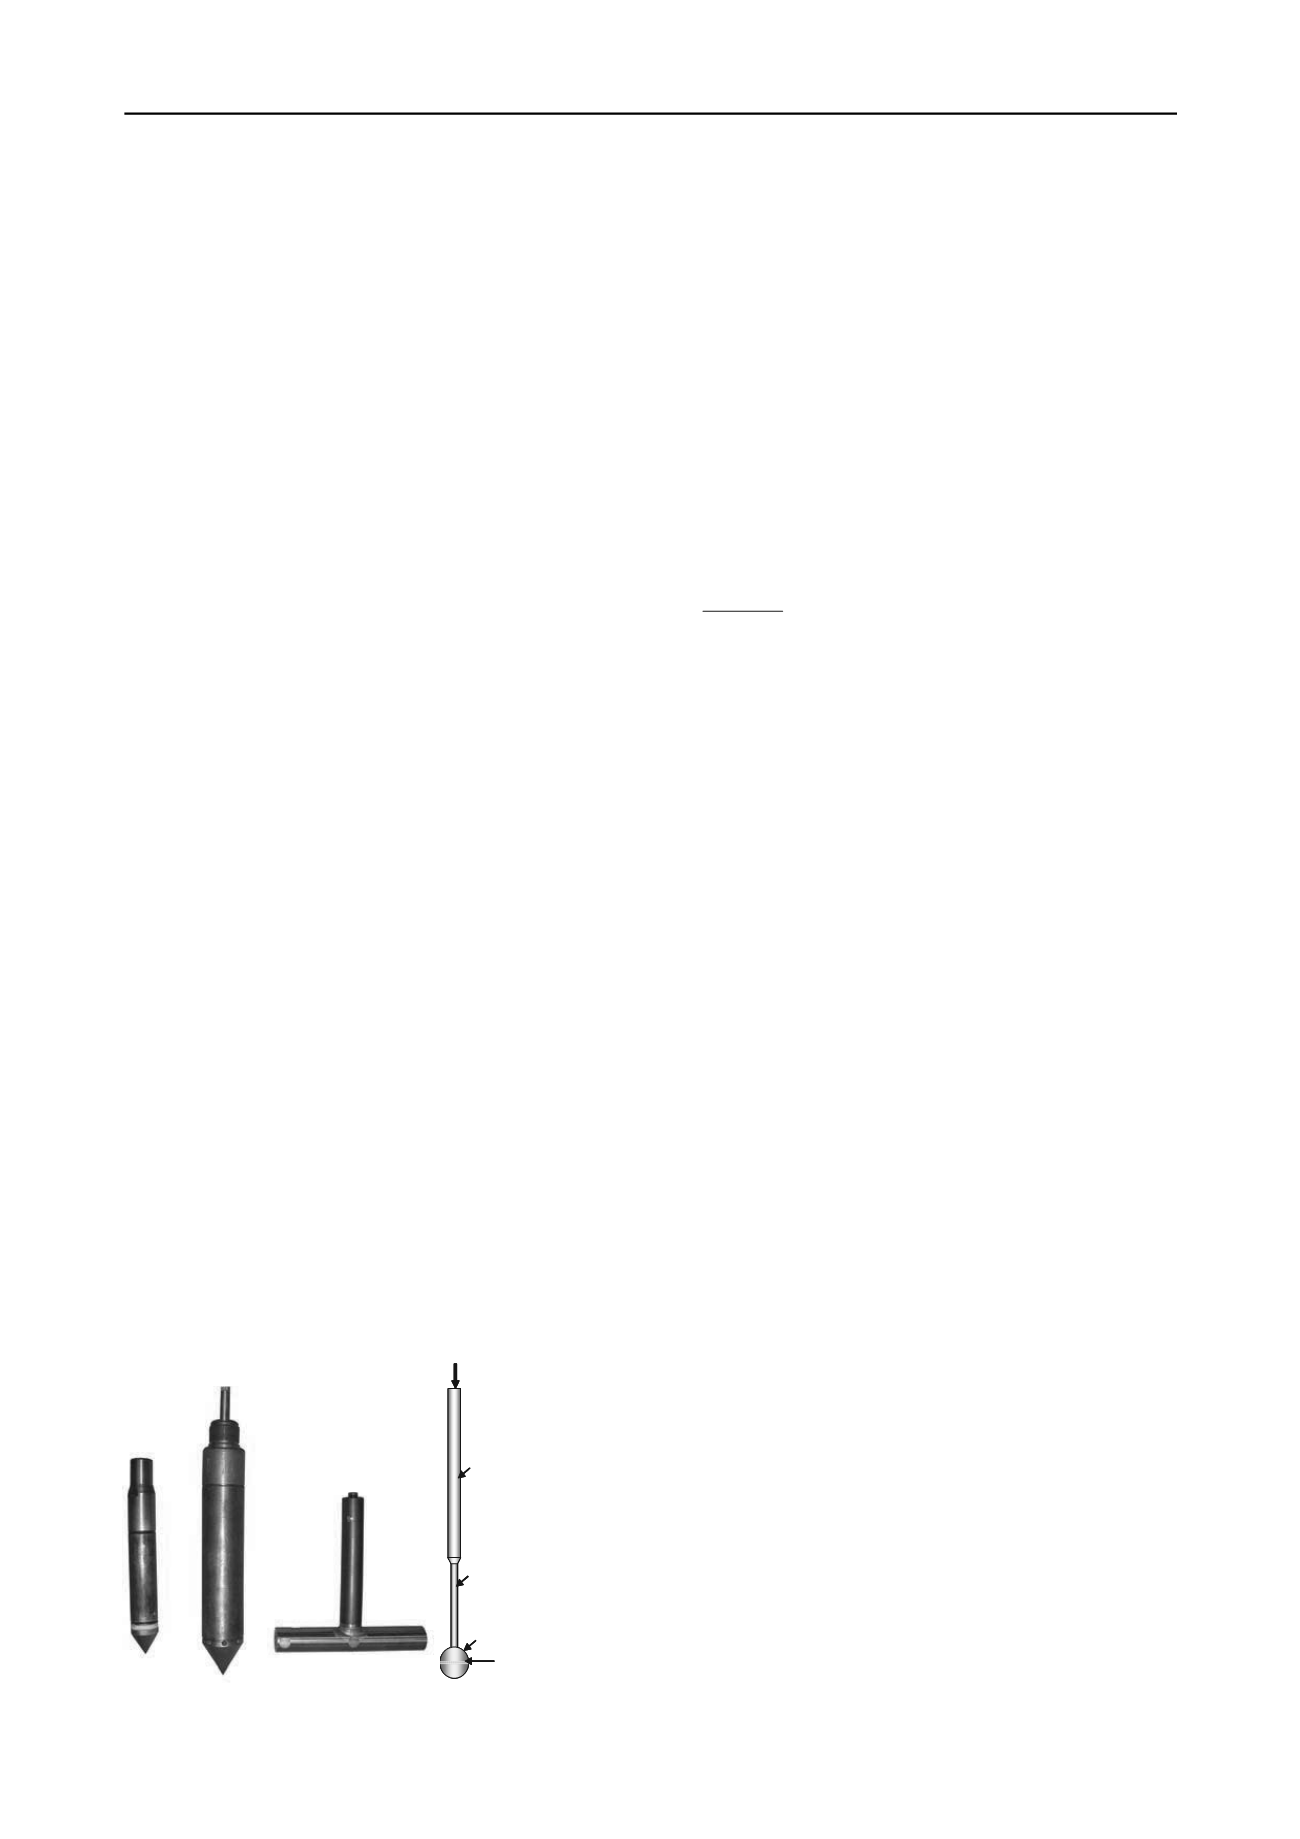
5 FULL-FLOW PENETROMETERS
Full-flow penetrometers, the cylindrical T-bar and spherical ball
(Figure 10), were introduced in the 1990s (Stewart and
Randolph 1994, Randolph et al. 1998). The main motivations
for their introduction included:
Penetrometer shapes that were amenable to plastic limit
analysis, with resistance independent of the pre-yield soil
stiffness.
Sufficient ratio of projected area to shaft area to render
corrections for pore pressure effects and overburden stress
minimal.
Ability to measure remoulded penetration resistance
directly, through cycles of penetration and extraction over a
limited depth range.
Reduced reliance on site-by-site correlations to obtain
resistance factors, and hence shear strength profiles.
The last of these has proved something of a disappointment, not
helped by an embedded culture with respect to interpretation of
cone penetrometer data.
Porewater
pressure filter
Instrumentation,
datastorageand
transmission
assembly
Push rodand
anti-friction
sleeve
Spherical ball
Penetrometer is thrust
intogroundusing
PRODdrill string
(a) Piezocones and T-bar
(b) Ball (Kelleher et al. 2005)
Figure 10 Range of penetrometers for in situ testing.
The relatively large projected areas of 10,000 mm
2
for the
standard T-bar, and generally 3000 to 5000 mm
2
for the ball
penetrometers used offshore, makes them attractive for
characterising soft clay deposits, but still with a capability to
penetrate sand layers with cone resistance of up to 3 or 4 MPa.
In particular, full-flow penetrometers have become the de facto
standard for strength profiling in the upper few metres, with
application to pipeline and riser design. Measurement of
remoulded resistance from cyclic tests, which also help to
constrain the accuracy of the monotonic penetration data, is
essential for pipeline design. While both geometries are used,
with the T-bar having superficial similarity to an element of
pipe, the ball is a kinder geometry and has the advantage of
enabling pore pressure measurement, as discussed later.
Plasticity solutions for the T-bar and ball in ideal (non-
softening, rate independent) soil give resistance factors that may
be approximated by Equation (13) or N
Tbar-ideal
= 9 + 3
, and
2
ideal
ball
u
2
u
06.1 04.5 21.11~
N
sD25.0
P
(25)
for the ball (Randolph et al. 2000, Einav and Randolph 2005). A
close linear fit for the ball is N
ball-ideal
~ 11.3 + 4
. Both sets of
results are for a Tresca soil model, and lead to resistance factors
for the ball that are 22 to 27 % greater than for the T-bar. This
difference reduces using a von Mises strength criterion, for
example down to about 15 % for an interface friction ratio of
0.3. Further reduction occurs for anisotropic shear strengths,
with a difference of 7 % for a ratio of triaxial extension and
compression strengths of 0.5 (Randolph 2000).
Experimental data are mixed in relation to any difference
between T-bar and ball penetration resistance, with some
reported profiles that are indistinguishable (Boylan et al. 2007,
Low et al. 2011), whereas profiles in highly sensitive clays
show differences of up to 16 %. This difference may be
attributed partly to greater reduction in the T-bar resistance due
to strain softening, compared with the ball (Einav and Randolph
2005). For soils of moderate sensitivity, the penetration
resistances for T-bar and ball are mostly within 5 to 10 %,
which is consistent with analytical results that take account of
strength anisotropy.
In natural soils, as opposed to the idealised perfectly plastic,
rate independent material on which plasticity solutions are
based, it is essential to allow for the relatively high strain rates
in the soil around the penetrometer, and also the gradual
softening of the soil as it flows around the cylinder or ball. This
has been looked at using a variety of numerical techniques,
ranging from a combined upper bound and strain path method
(UBSPM; Einav and Randolph 2005), large deformation finite
element analysis (LDFE; Zhou and Randolph 2009a), and a
steady state finite difference approach (SSFD; Klar and Pinkert
2010). All three approaches adopted a similar logarithmic law
of rate dependence, with a relative strength gain of
per tenfold
increase in strain rate, and an exponential softening law with
95 % reduction to the fully remoulded shear strength for a
cumulative plastic strain of
95
. Of the three approaches, the
LDFE analysis tends to give the lowest (average) resistance,
since it is able to capture the periodic generation and softening
of distinct shear bands, accompanied by a corresponding cyclic
variation in the penetration resistance.
Resistance factors evaluated using LDFE analysis (see
Figure 11) may be expressed as (Zhou and Randolph 2009a)
ideal
ball
/
5.1
rem
rem
ball
ideal
Tbar
/
5.1
rem
rem
Tbar
N
e
1
8.41
N
N
e
1
8.41
N
95
ball
95
Tbar
(26)


