97
Honour Lectures /
Conférences honorifiques
Proceedings of the 18
th
International Conference on Soil Mechanics and Geotechnical Engineering, Paris 2013
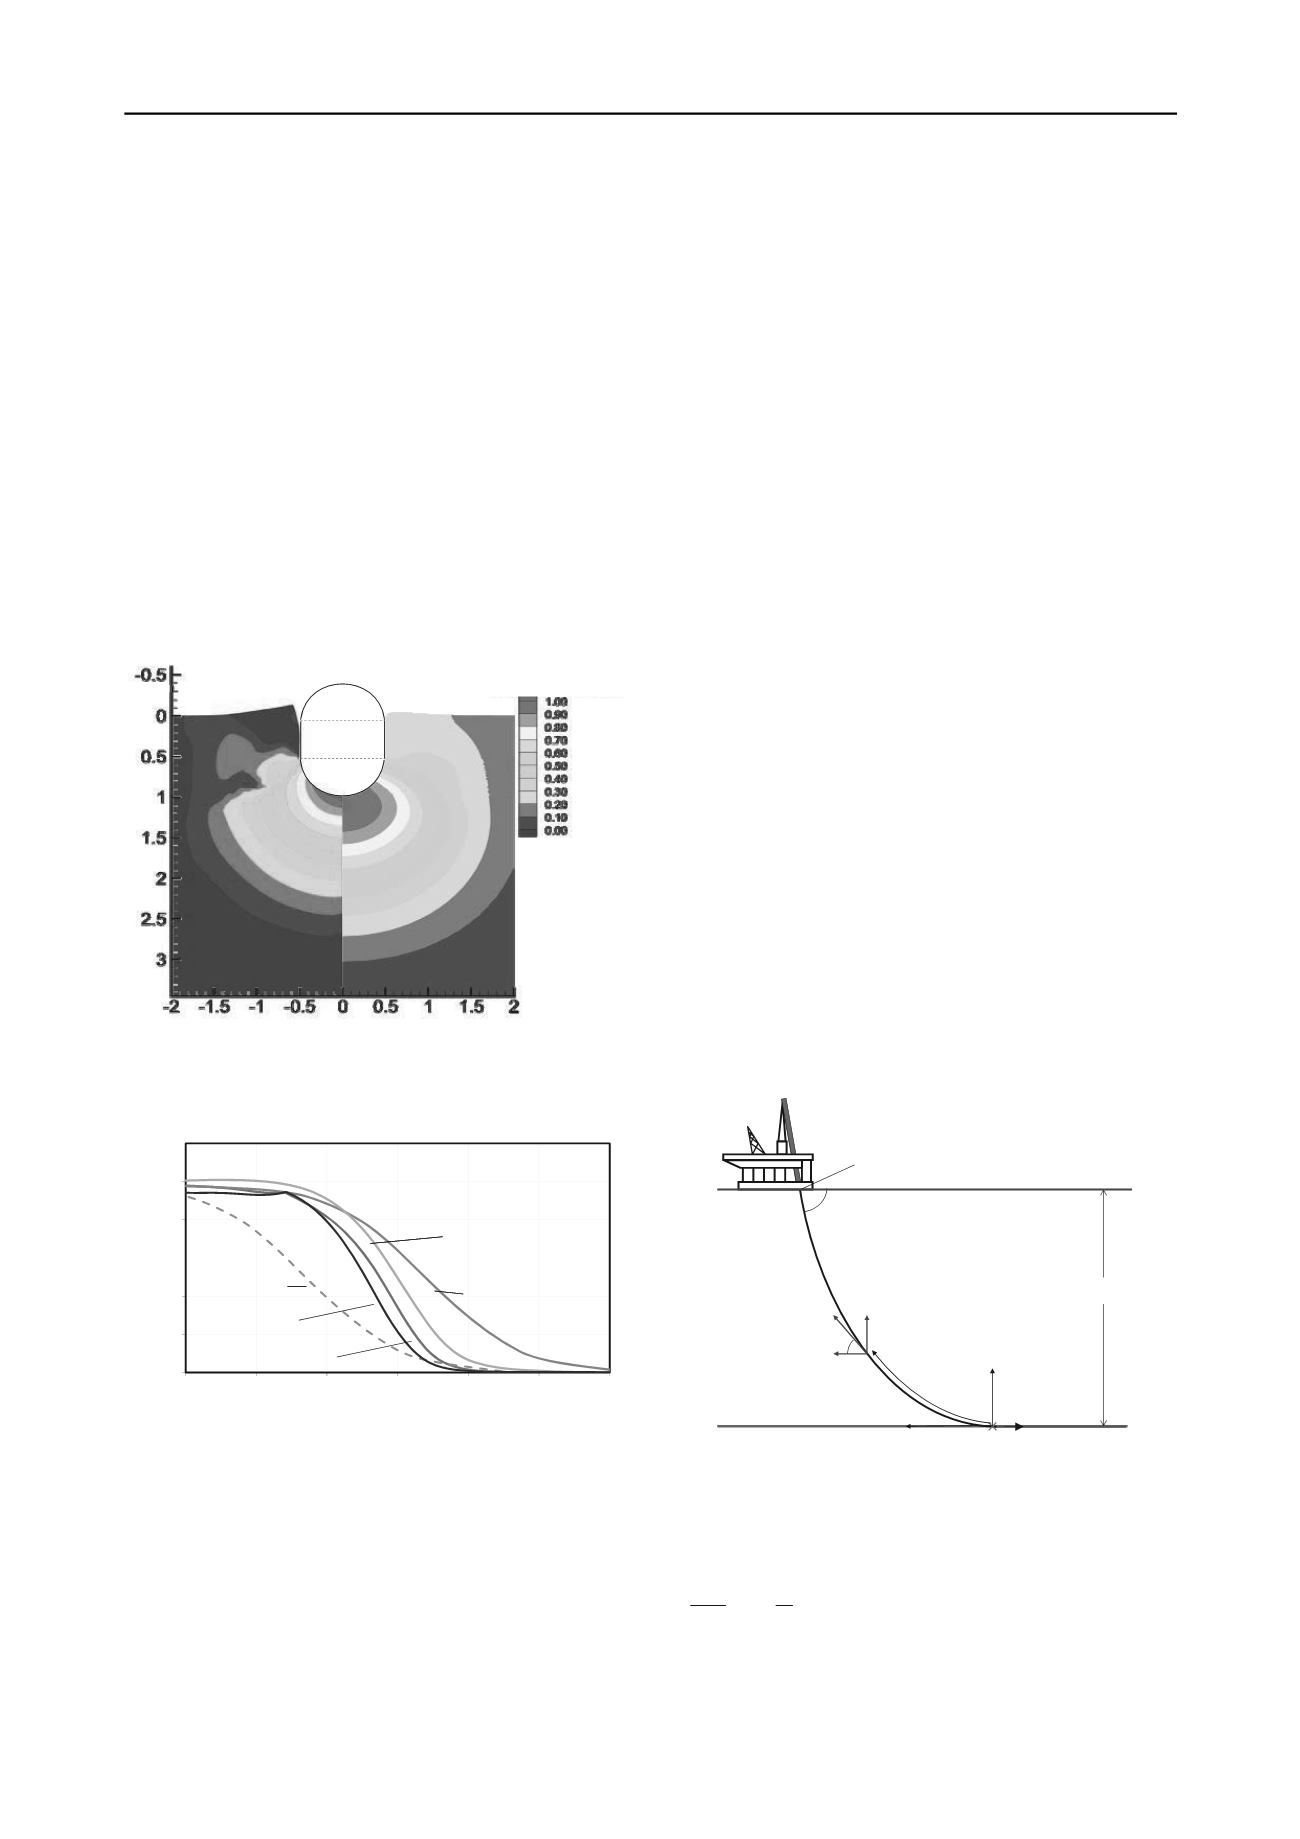
initial excess pore pressure, normalised by the invert value, for
two different boundary conditions (Chatterjee et al. 2013).
Natural conditions (left side) with the shear strength increasing
linearly with depth were simulated using a nominal 1 kPa
surcharge at mudline (the minimum to allow numerical stability
during the analysis). Alternatively, in order to simulate
approximately uniform strength and stiffness conditions, an
artificial 200 kPa surcharge was applied (right side).
The resulting consolidation responses are shown in
normalised form in Figure 16 for two different embedments
(w/D = 0.5 and 1). For comparison, dissipation curves for a
pipeline (two-dimensional) and a deeply embedded piezocone
(Teh and Houlsby solution) are also shown. The parkable
pieozoprobe (PPP) shows more rapid dissipation, for a given
diameter, due to its geometry and shallow embedment. For
comparison, a curve for a standard diameter piezocone is also
shown, scaled according to the relevant diameters. Although the
PPP takes longer for the excess pore pressures to dissipate (by a
factor of about 7 for t
50
), the concept for the device is that this
occurs in parallel with the primary site investigation activities,
so off the critical time line.
Excess pore pressure/Invert value
1 kPa surcharge
200 kPa surcharge
z/D
x/D
Figure 15 Initial normalised excess pore pressure distributions for cases
of strength increasingly linearly with depth (1 kPa surcharge) and quasi-
homogenous conditions (200 kPa surcharge).
0
0.2
0.4
0.6
0.8
1
1.2
0.0001
0.001
0.01
0.1
1
10
100
u/
u
i
T = c
v
t/D
2
CPT (using D
CPT
)
CPT (using D
PPP
)
Pipeline
PPP, w/D = 0.5
(w/D = 0.5)
PPP, w/D = 1
(c)
Figure 16 Pore pressure dissipation time history for different
geometries and embedment (after Chatterjee et al. 2013).
6 PIPELINES AND RISERS
Geotechnical engineering design for pipelines and risers has
matured significantly over the last decade, responding to the
buckling related design challenges arising from thermal and
pressure-induced expansion and contraction of deep water
pipelines. (Note, the terminology ‘pipelines’ is used here
generically, to include the many different functional names used
in the industry, covering flowlines, umbilicals, MEG lines and
export pipelines.) Summaries of recent developments have been
provided in the keynote papers of Cathie et al. (2005) and White
and Cathie (2010). Here, a brief overview is given of some
analytical results that have contributed to design approaches.
In deep water, geotechnical design is concerned primarily
with issues associated with lateral buckling, which has been the
topic of a longstanding joint industry project, the SAFEBUCK
JIP (Bruton et al. 2007, 2008). Pipeline buckling is engineered,
rather than suppressed, by appropriately spaced buckle
initiators, or snake-lay of the pipeline. The axial and lateral
resistance offered by the shallow sediments on which the
pipelines rest are key inputs to the design. Both of these depend
firstly on the embedment of the pipeline into the sediments, and
secondly on the velocity and time scale of the movement
relative to the soil consolidation characteristics.
6.1
Pipeline embedment
Pipeline embedment occurs during the lay process, while the
pipeline is suspended from the lay vessel, in much the same way
as a (more permanent) steel catenary riser (SCR) is suspended
from a floating production system (Figure 17). Embedment
occurs due to the submerged weight of the pipeline, which is
augmented by static and dynamic force concentrations for each
segment of pipeline as it passes through the touchdown zone.
The period within the touchdown zone, and hence the extent of
cyclic motions undergone by a given segment of pipe due to
wave-induced motions of the lay vessel, will depend on the lay
rate; the magnitude of the motions and ratio of dynamic to static
force concentration will depend on the sea state conditions as
the pipeline is laid.
At intermediate depth scales the shear strength profile of
deep water sediments may show a mudline intercept of a few
kPa (Colliat et al. 2010). However, in the upper 0.5 m that is
critical for pipeline design, there is rarely any detectable
strength intercept at the mudline. The initial shear strength
gradient,
, may range from as low as 1 to 1.5 kPa/m, where
there is no crustal feature, to ~30 kPa/m, where locally high
shear strengths occur, typically at depths of 0.4 to 1 m. Such
crustal features are considered to be due to bioturbation
(DeJong et al. 2013, Kuo and Bolton 2013).
t
z
w
Pipeline:
Diameter, D;
Bending rigidity, EI
Submerged weight, W'
Tension, T
0
Seabed (stiff)
Sea surface
Touchdown point (TDP)
z
x
s (arc length)
T
0
(constant)
T W's
Hang‐off point
Figure 17 Schematic of SCR or pipeline during lay process.
The static penetration resistance for a pipeline of diameter,
D, in sediments with strength proportional to depth may be
expressed as (Chatterjee et al. 2012a)
17.0
2
D
w7.4
D
V
(31)
where
is the shear strength gradient and V and w are the
vertical force per unit length and penetration respectively.


