96
Proceedings of the 18
th
International Conference on Soil Mechanics and Geotechnical Engineering, Paris 2013
Proceedings of the 18
th
International Conference on Soil Mechanics and Geotechnical Engineering, Paris 2013
pressure,
u
ref
. Best fit parameters to the numerical and
experimental data are V
50
~ 3, and the exponent c ~ 1.
Adopting
u
p0
as the initial excess pore pressure, falsely
assuming undrained penetration, will lead to underestimation of
the consolidation coefficient, because the time, t
50
, for (a
further) 50 % dissipation will be longer than if the penetration
phase had indeed been undrained. Detailed analysis of this is
provided by DeJong and Randolph (2012), and the resulting
hypothesised relationships between t
50
and c
v
are illustrated in
Figure 12, taking I
r
= 100 and V
50
= 3. An interesting feature of
the results is that, for the best fit parameters of b = 0.75 and
c = 1, the value of t
50
reaches a minimum of about 10 s for
c
v
~ 400 to 500 mm
2
/s (around 15,000 m
2
/yr), before starting to
increase again. Obviously this contrasts with the monotonically
decreasing relationship for true undrained conditions provided
by the Teh and Houlsby (1991) solution.
0.1
1
10
100
1000
1
10
100
1000
10000
t
50
(s)
c
v
(mm
2
/s)
I
r
=100, V
50
= 3
Teh & Houlsby
b = 0.75, c = 1
b = 0.75, c = 0.75
b = 1, c = 1
Figure 12 Variation in anticipated t
50
with c
v
, following partially
drained penetration.
For the same values of V
50
, b and c, and assuming standard
piezocone parameters of d
cone
= 36 mm and v = 20 mm/s, the
relationship in Figure 12 may be written as (DeJong and
Randolph 2012):
2.1
v
v
r
50
c25.0 78
c
I
~ t
(30)
The corresponding minimum values of t
50
range between 7 and
20 s, for rigidity index, I
r
, between 50 and 400. From Figure 12,
the standard interpretation of a piezocone test becomes
questionable once t
50
is less than about 50 s.
Ball penetrometers are also generally fitted with pore
pressure sensors, in commercial practice either at the tip or at
the ‘equator’ position (maximum diameter). However,
experimental data has shown that, even in normally or lightly
overconsolidated clay, the excess pore pressure tends to rise
initially at the equator position at the start of a dissipation test,
and the overall shape of the dissipation response varies
somewhat between tests (DeJong et al. 2008). By contrast, pore
pressure measurement at the ‘mid-face’ (a latitude of 45 º south
from the equator) gives more consistent data, and with the
maximum excess pore pressure occurring at the start of the
dissipation test, provided the penetration occurs under
undrained conditions (Mahmoodzadeh and Randolph 2013).
Typical dissipation responses from centrifuge model tests of
piezocone and piezoball penetrometers in normally consolidated
kaolin clay are shown in Figure 13. The time axis has been
normalised by the diameters (10 mm for the cone, and 15 mm
for the ball) and c
v
values based on data from Rowe cell tests.
For the relevant stress level of 110 kPa, the Rowe cell c
v
is
4 m
2
/yr. This has been multiplied by the
/
ratio of 4.7 for the
Modified Cam Clay kaolin parameters adopted for the LDFE
analyses, to reflect the (primarily) swelling stress path during
pore pressure dissipation, giving c
v
= 19 m
2
/yr (0.6 mm
2
/s).
The piezocone experimental data match reasonably well the
Teh and Houlsby (1991) solution for rigidity index of I
r
= 76
(consistent with the model for kaolin adopted in numerical
analysis). The experimental piezoball data are compared with a
dissipation curve obtained by large deformation finite element
(LDFE) analysis using the Modified Cam Clay model and a
permeability consistent with the Rowe cell c
v
value
(Mahmoodzadeh et al. 2013). Both theoretical and experimental
dissipation curves show a difference in T
50
by a factor of 5,
compared with the factor of ~2.5 observed by Low et al. (2007)
from field tests using a piezoball with pore pressure sensor at
the equator.
0
10
20
30
40
50
60
70
80
90
100
0.001
0.01
0.1
1
10
Normalised excess pore pressure,
u/
u
0,extrapolated
Non-dimensional time factor, T=c
v
t/d
2
Piezocone
Teh & Houlsby
(I
r
= 76)
Experimental
Piezoball
(mid-face)
Experimental
LDFE
analysis
Figure 13 Dissipation responses from centrifuge model piezocone and
piezoball tests compared with numerically derived dissipation curves.
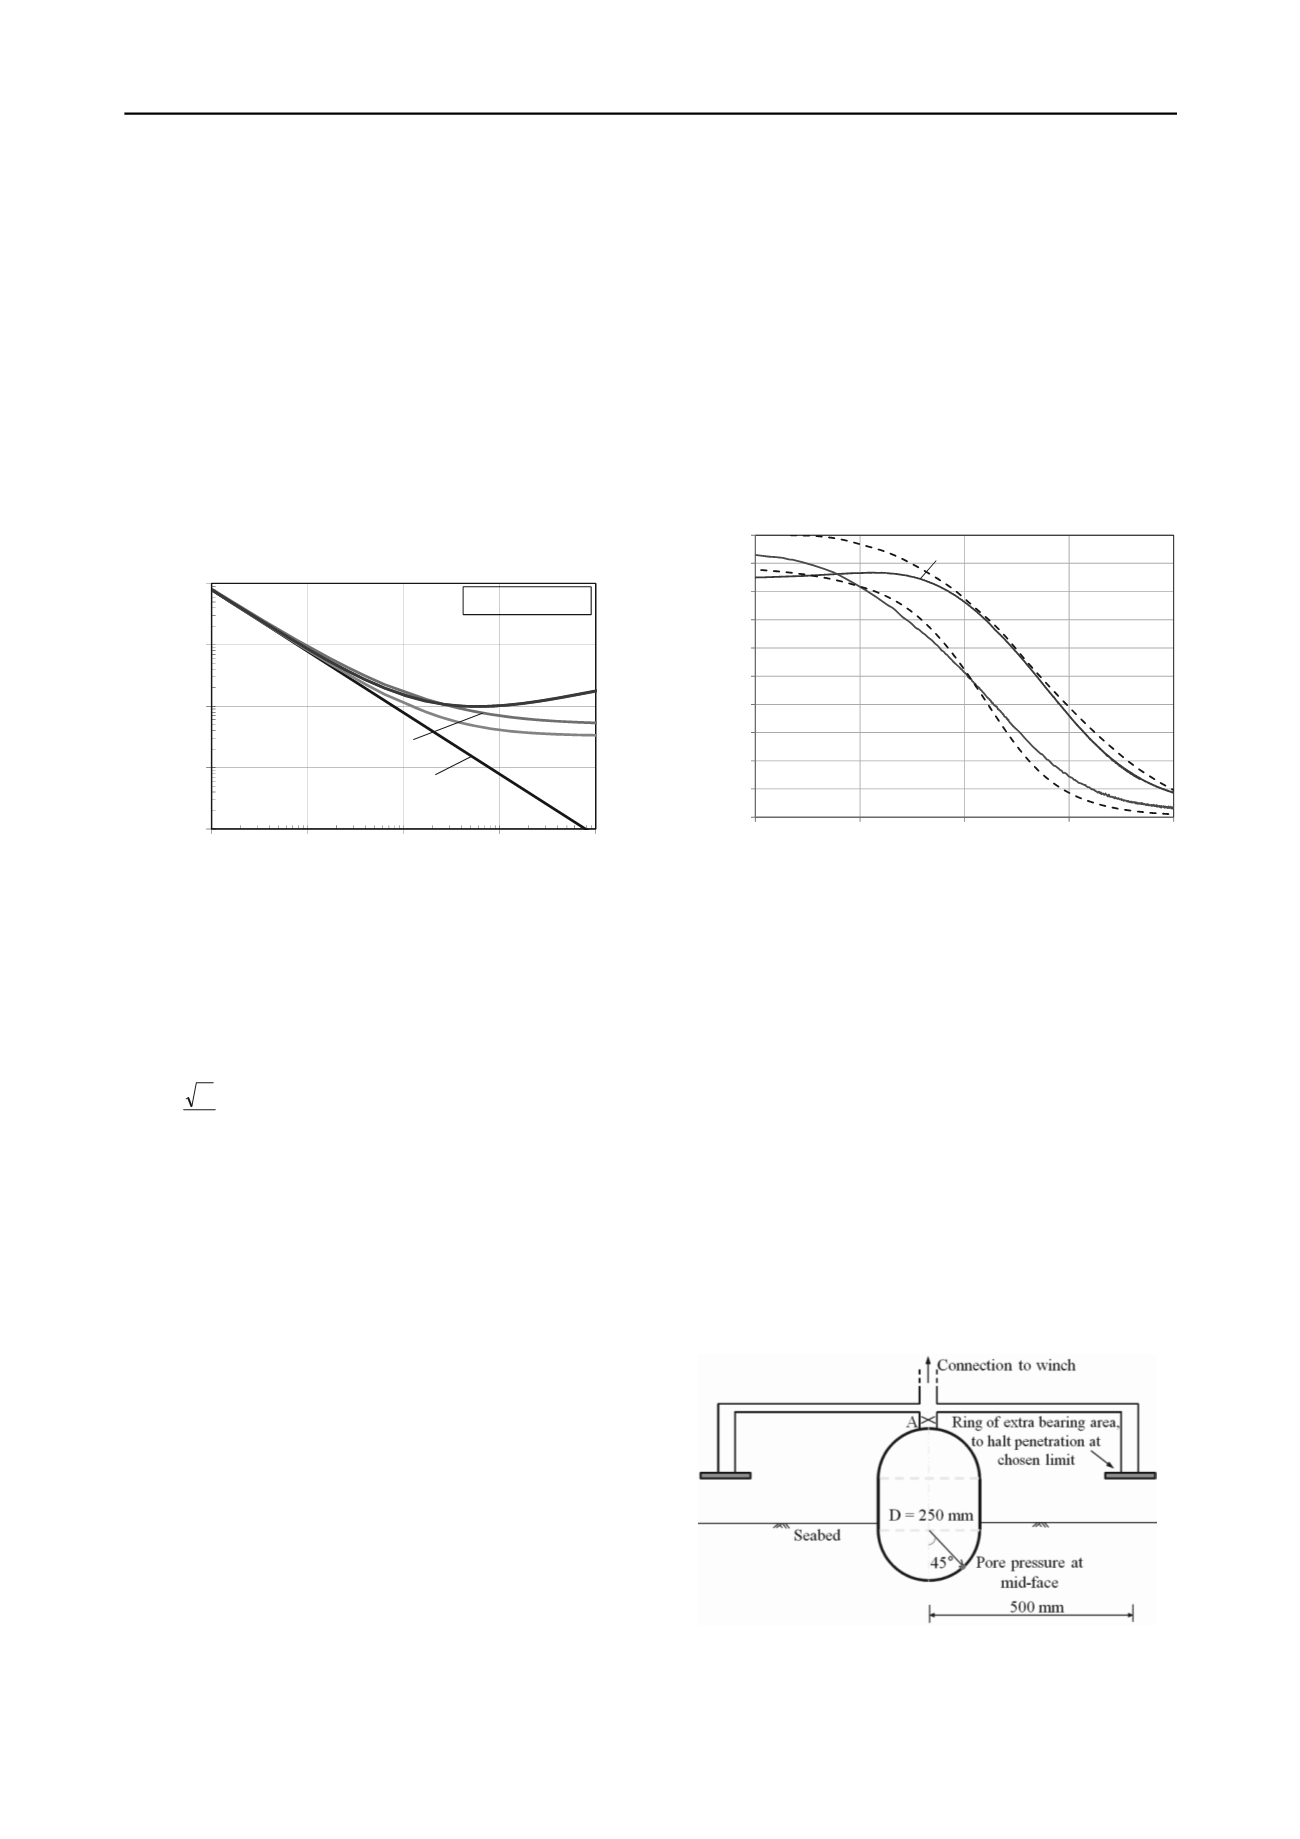
One of the primary design applications requiring knowledge
of the consolidation coefficient is for pipeline design, where the
focus is on the upper 0.5 m or so of the seabed. It would be
difficult to obtain meaningful data from dissipation testing
within that zone, since the proximity to the free surface would
affect both the initial stress field following penetration, and
potentially the drainage paths and thus the dissipation response.
An alternative approach has been proposed recently, which also
minimises any time penalty associated with the duration of
conventional dissipation testing. The proposed device is a
‘parkable’ piezoprobe, as shown schematically in Figure 14
(Chatterjee et al. 2013). It comprises a solid steel cylinder with
hemispherical ends, approximately 250 mm in diameter and
375 mm high. An outrigger may be fitted to provide sufficient
force (of 1 to 2 kN) and to limit the embedment to no more than
one diameter. The device is designed to be lowered by a winch,
from either an ROV or a seabed site investigation system, with
measurements gathered in parallel with the main site
investigation activities, thus minimising time penalty.
Figure 14 Parkable piezoball concept.
In order to provide a theoretical framework to validate the
design concept and establish appropriate dissipation curves,
LDFE analyses were undertaken. Figure 15 shows contours of


