87
Honour Lectures /
Conférences honorifiques
Proceedings of the 18
th
International Conference on Soil Mechanics and Geotechnical Engineering, Paris 2013
(Dutt and Ehlers 2009), and of suction caisson extraction
resistance (Colliat and Colliard 2010).
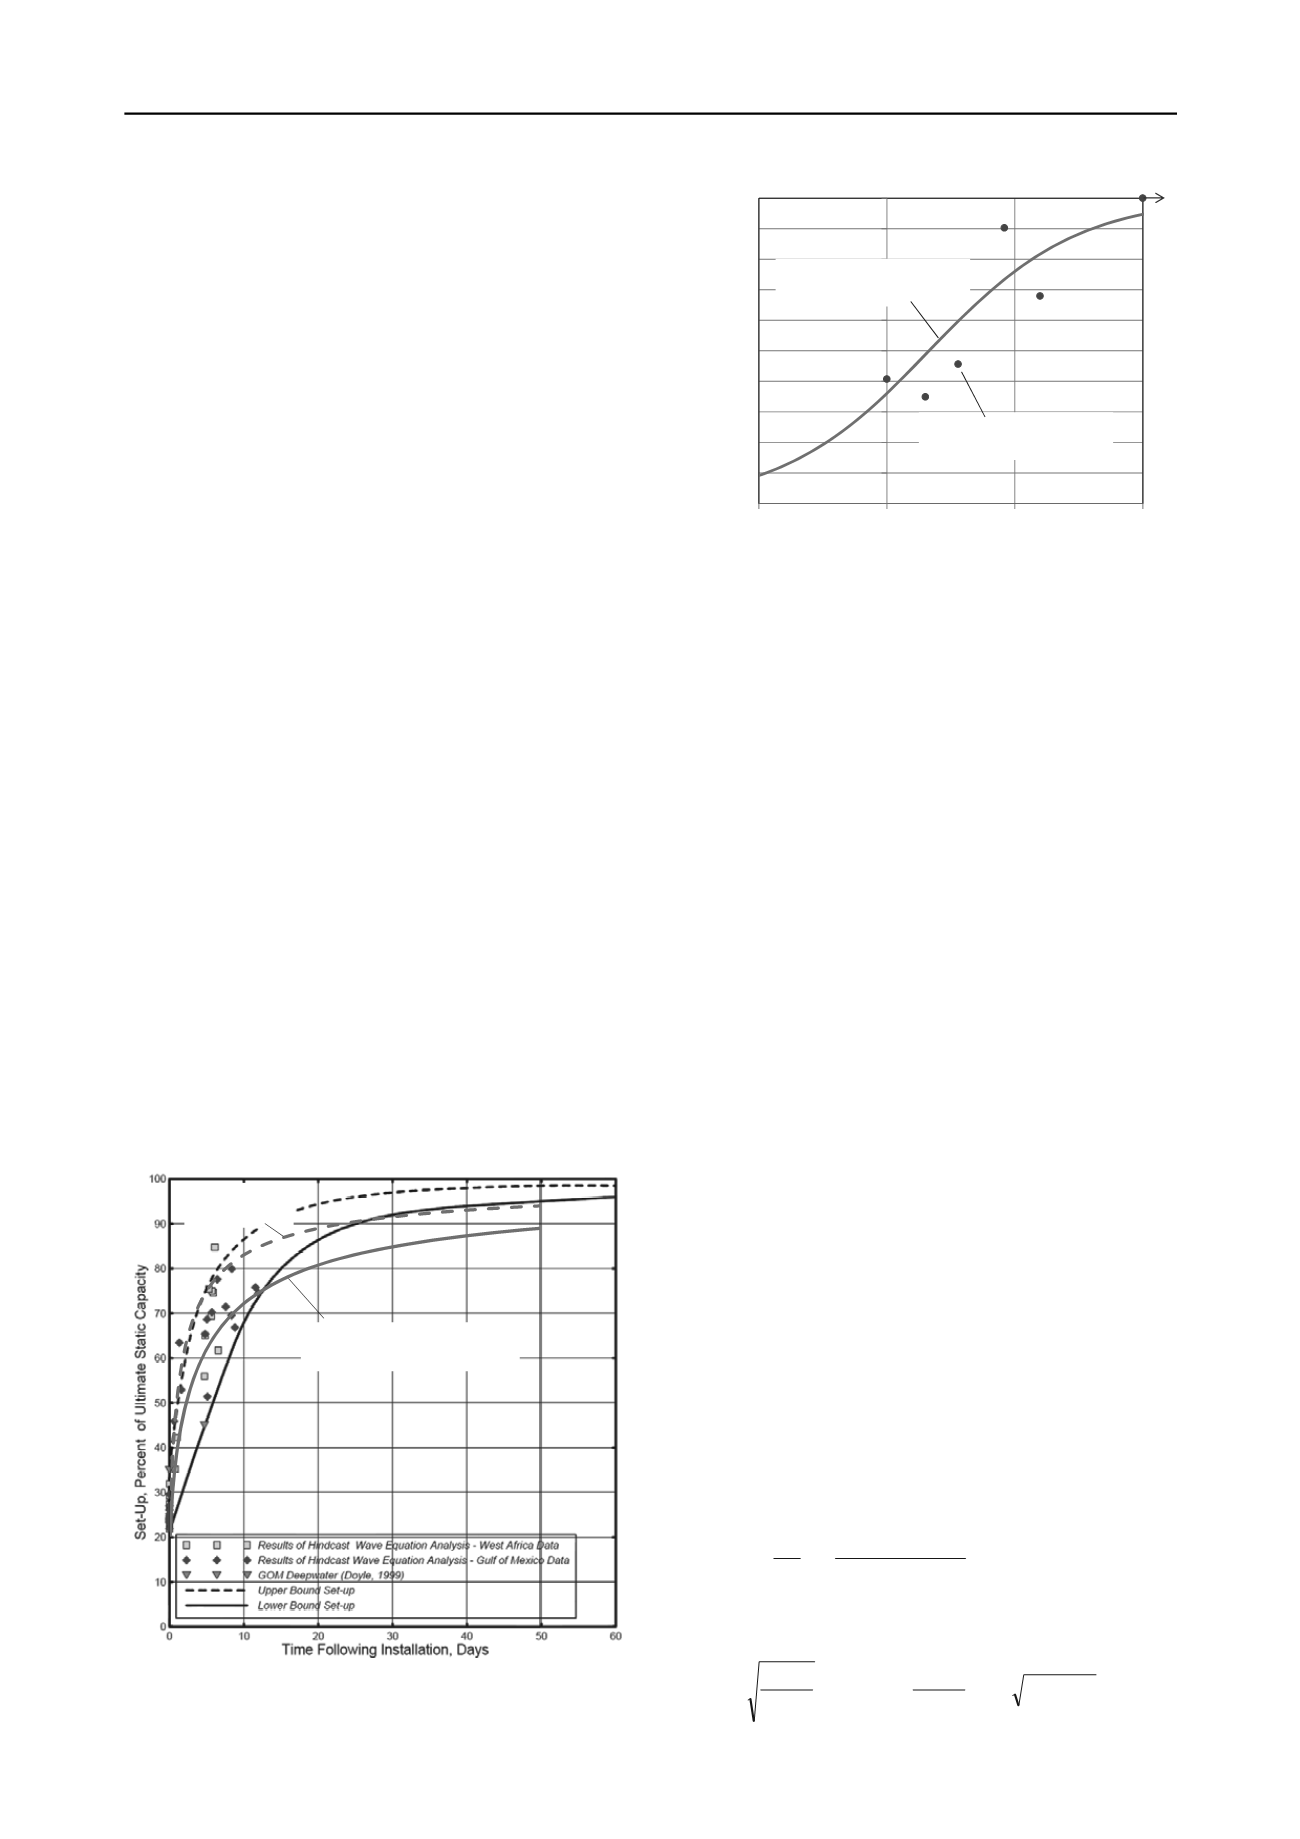
Figure 1 shows a comparison of the radial consolidation
solution with the driving resistance data from Dutt and Ehlers,
taken from sites off the coast of West Africa and in the Gulf of
Mexico. The long term driving resistance was estimated directly
from the API design guidelines, since the longest re-drive delay
was only 8 days (West Africa) to 12 days (Gulf of Mexico). The
data were plotted together, even though the pile diameters
varied between 2.7 m (West Africa, diameter to wall thickness
D/t = 40, so D
eq
= 0.85 m) and 2.1 m (Gulf of Mexico: D/t = 48,
so D
eq
= 0.6 m). The initial driving resistance was around 20 %
of the (estimated) long term resistance, so the analytical
consolidation solution has been adjusted to give a proportion of
long term resistance of 0.2 + 0.8U. The solution matches the
Gulf of Mexico data reasonably, with a plausible consolidation
coefficient of c
v
= 20 m
2
/yr. The data from West Africa do not
show a clear trend, but are mostly bounded by a theoretical
curve for c
v
= 100 m
2
/yr. Although this seems quite high, these
piles were driven to a depth of 150 m, twice the depth of the
Gulf of Mexico piles, and so is reasonable as an upper bound.
Data from suction caissons from offshore West Africa are
shown in Figure 2. The suction caissons were extracted (by
pumping water into them) at different periods following
installation (Colliat and Colliard 2010). The diameters ranged
between 3.8 and 8 m, and penetration depths from 16.5 to
20.5 m. Although much greater diameter than typical driven
piles, the values of wall thickness were only 20 or 25 mm.
Allowing for only 50 % of the soil displaced being pushed
outwards (Zhou and Randolph 2006), the equivalent diameters
are only 0.28 to 0.45 m.
The relative increase in shaft resistance has been obtained by
normalising by the original shaft resistance. The longest elapsed
time was 1260 days, where the reported shaft resistance was
2.03 times the installation value (the data point is plotted at a
reduced time of 100 days, in order to limit the time axis). All
data points on Figure 2 have been plotted after first scaling the
actual time by (0.3/D
eq
)
2
in order to give a common basis of
comparison. Inevitably there is some scatter in the data, but the
theoretical consolidation curve for c
v
= 10 m
2
/yr (and
D
eq
= 0.3 m) lies within a factor of about 2 for all but one
datapoint. The coefficient of consolidation seems reasonable,
given that the average depth is almost an order of magnitude
lower than for the driven piles in Figure 1.
Radial consolidation solution
(c
v
= 20 m
2
/yr; D
eq
= 0.6 m)
c
v
= 100 m
2
/yr;
D
eff
= 0.85 m
Figure 1 Increase in pile shaft capacity with time following driving
(field data and original figure from Dutt and Ehlers 2009).
0
0.1
0.2
0.3
0.4
0.5
0.6
0.7
0.8
0.9
1
0.1
1
10
100
Relative increase in shaft resistance
Time (days) - scaled for D
eq
= 0.3 m
Radial consolidation solution
(c
v
= 10 m
2
/yr; D
eq
= 0.3 m)
Data from suction anchors
(Colliat & Colliard 2011)
Figure 2 Increase in suction caisson extraction resistance with time
following installation.
The time scale of consolidation reported by Colliat and
Colliard (2010) is similar to that noted by Jeanjean (2006), for
suction caissons with diameters 2.9 to 3.7 m (equivalent
diameters of 0.39 to 0.53 m). Unfortunately, though, the latter
dataset did not include any short term restart or retrieval data,
with the earliest being after a time delay of 50 days (equivalent
to 16 days for D
eq
= 0.3 m). As such, all cases showed relative
increases in excess of 50 %. The average long term (~1000 day)
increase in shaft resistance was only 75 %, compared with
100 % for the West Africa suction caisson data.
It is perhaps disappointing that greater use is not made of
rigorous consolidation analysis in estimating the time scale for
the increase in shaft resistance of piles and suction caissons.
Commentary on the topic is partly obscured by musings on
thixotropy, which may play a role but with no guidance
provided on how to scale from laboratory to field. Ultimately
the shaft resistance results from the increase in normal effective
stress, which is adequately modelled by consolidation analysis.
2.3
Axial load-displacement response
In the offshore industry it is customary to use load transfer
methods to evaluate the axial load-displacement response. Non-
linear load transfer curves allow the full pile response to be
evaluated, from the initial quasi-linear response right up to
failure. It is instructive, though, to consider the form of the load
transfer curves, and elastic solutions for the complete pile that
are applicable at low load levels.
Analytical solutions for axial pile response abound, with
gradually increasing degree of sophistication, starting with
Murff (1975) for the case of a linear load transfer stiffness, k
a
,
uniform with depth. Randolph and Wroth (1978) related the
load transfer stiffness to the soil shear modulus, G, and
extended the solution in an approximate manner to consider a
linear variation of modulus with depth. This was later extended
in a more rigorous manner by Guo and Randolph (1997) for
power law variations of modulus with depth, and by Mylonakis
and Gazetas (1998) for layered profiles, and with allowance for
interaction effects between piles.
The solutions for uniform soil modulus with depth may be
expressed in the generic form of
L tanh KS
L tanh S K
S
w
P
K
b
b
t
t
axial
(3)
with
ap
p
p
a
k EA L
L
EA
S
and L
EA
k
L
(4)


