95
Honour Lectures /
Conférences honorifiques
Proceedings of the 18
th
International Conference on Soil Mechanics and Geotechnical Engineering, Paris 2013
The quantity,
Tbar
, in Equation (26) reflects the average plastic
shear strain experienced by a typical soil element as it flows
around the T-bar. The corresponding quantity for a ball was
found to be about 10 % lower (
ball
~ 3.3, compared with
Tbar
~ 3.7 – Zhou and Randolph 2009a). Of course, the actual
degree of softening will vary with the original distance of the
soil element from the axis of the advancing penetrometer, since
soil elements immediately adjacent to the penetrometer will
undergo the greatest softening.
5
10
15
20
25
0
0.05
0.1
0.15
0.2
0.25
Rate parameter
N
Tbar
95
= 50
95
= 25
95
= 15
Parameters
=
rem
= 0.2
Tbar
= 3.7
95
= 10
No strain softening
gradient = 4.8
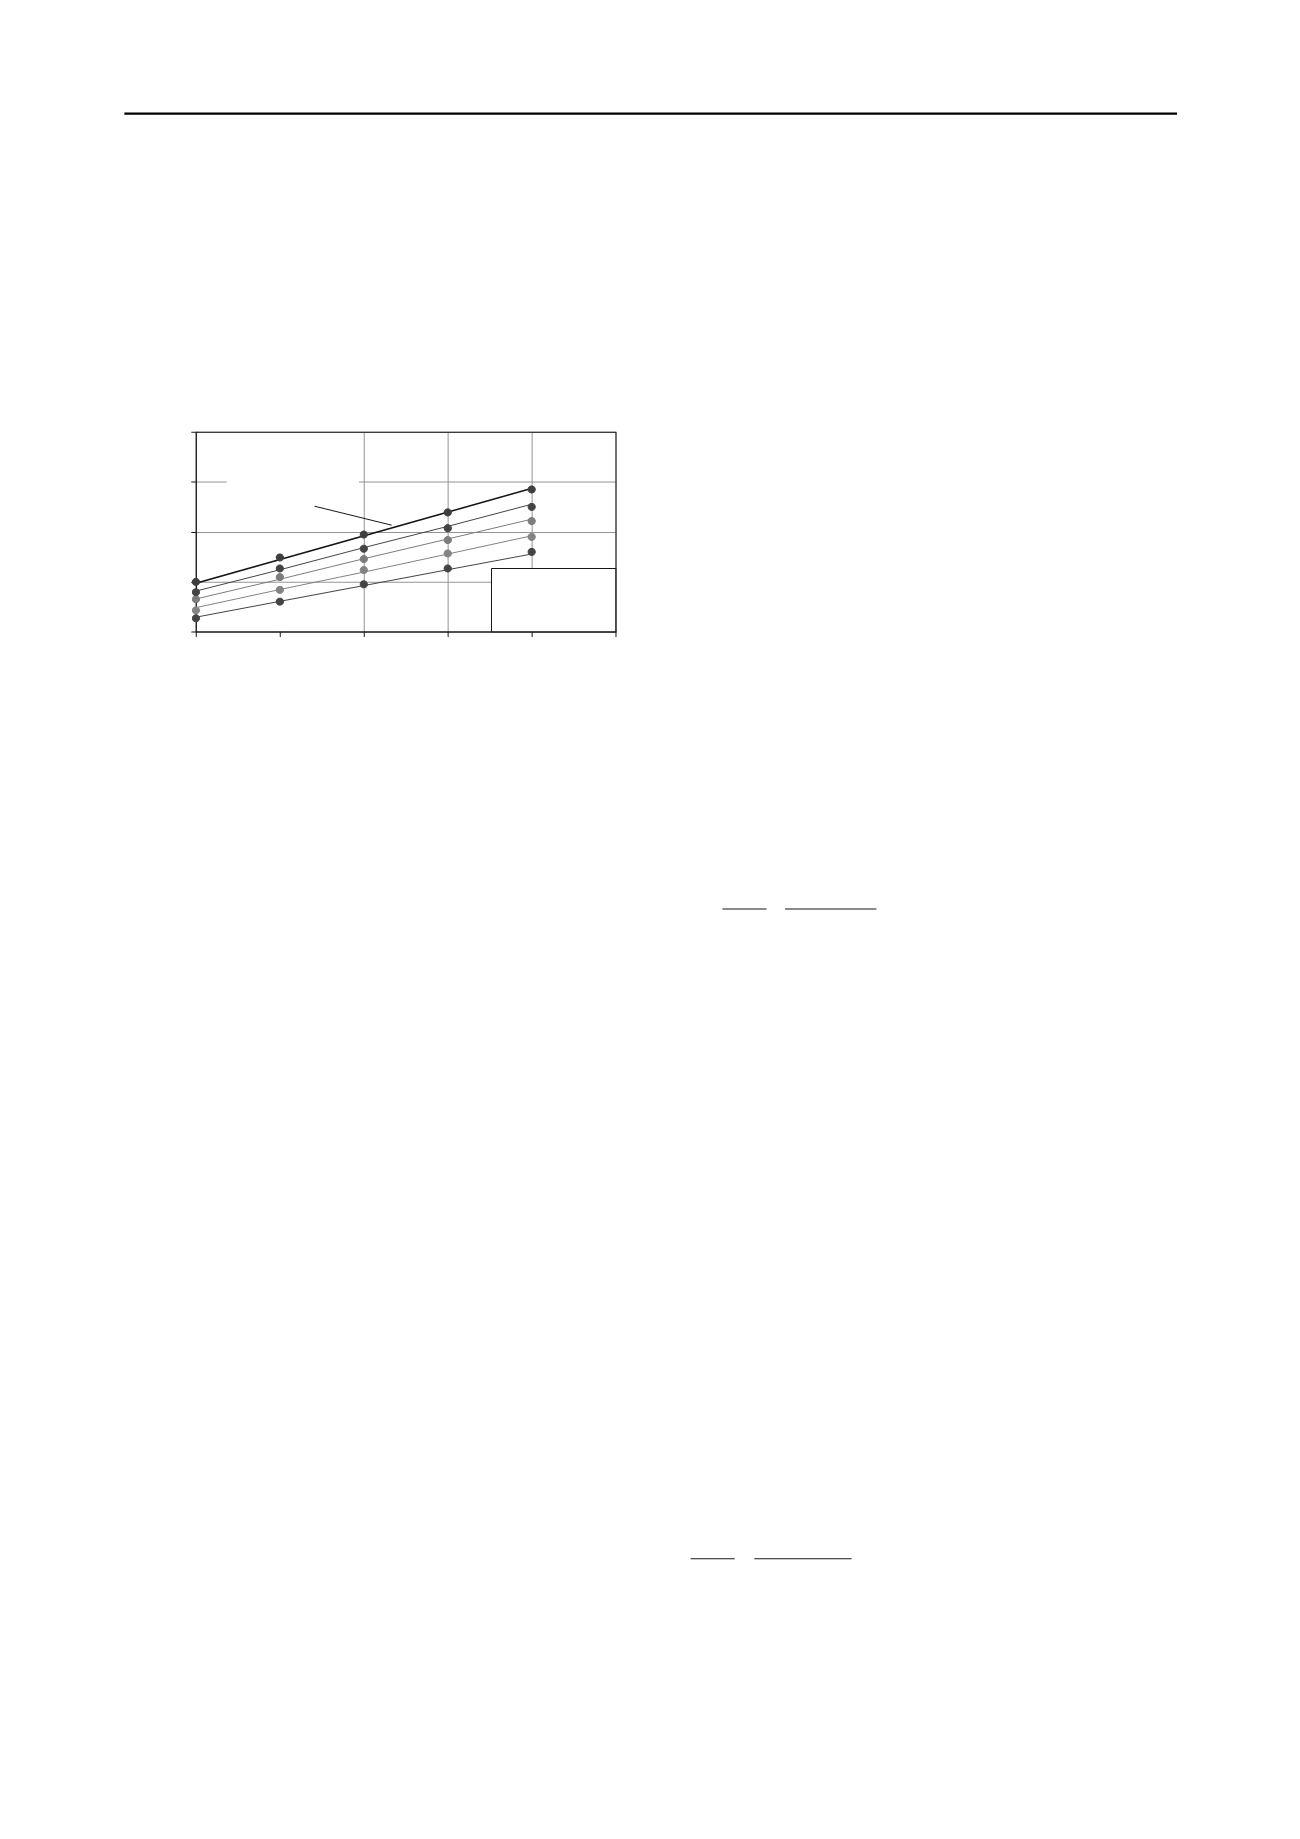
Figure 11 Values of T-bar resistance factor after allowing for rate
effects and strain softening (sensitivity of S
t
= 5, friction ratio,
= 0.2).
The terms, 1 + 4.8
, in Equation (26) reflect the average
strain rate, which is some 5 orders of magnitude greater than the
nominal ‘laboratory’ reference strain rate of 1 %/hr. This term
should be viewed with some caution, owing to the limitations of
the logarithmic rate law itself, and the inadvisability of trying to
extrapolate over such a large range of strain rates.
Notwithstanding the above reservation, the analytically
derived T-bar and ball factors carry information and should be
made use of during the interpretation of field data. Where both
ball and T-bar penetrometers are used (and similarly for cone
and either T-bar or ball penetrometers), resistance factors
should fall within an appropriate relative range, for example
with N
ball
no more than 10 % greater than N
Tbar
unless the soil
sensitivity exceeds 10.
Low et al. (2010) summarised penetrometer data from a
number of offshore (and some onshore) sites around the world,
recommending global average resistance factors of 11.9 (with
standard deviation of 1.4) for T-bar and ball, relative to an
average or laboratory simple shear strength. A similar value of
12 was proposed for N
Tbar
for low sensitivity clays by DeJong et
al. (2011), although their ball factor was 10 % higher. These
values are plausible, in relation to Figure 11, for example for
soils with a rate dependency factor of
~ 0.1, sensitivity of 3 to
5 and
95
in the range 15 to 25.
Some of the parameters that determine the resistance factors
can be deduced from the tests themselves; thus cyclic tests
enable the sensitivity to be estimated, while tests at different
penetration speeds (best performed at the end of a cyclic test
when the soil strength has stabilised to the remoulded value)
allow the rate parameter to be assessed. The resistance factors
from individual sites summarised by Low et al. (2010) suggest
that for soils of moderate plasticity the T-bar and ball resistance
factors are closer to 11 than 12, while in the ultra-high plasticity
soils off the coast of West Africa the average was around 13.
This suggests higher strain rate dependency of the West African
soils, for example with
closer to 0.15 rather than 0.1.
Higher sensitivity implies low interface friction ratio, as well
as greater loss of strength during passage of the penetrometer.
Numerical analysis for rate dependent (
= 0.1) and softening
(
95
= 15) material, gave ball resistance factors reducing from
21.5 to 11.6 for sensitivities increasing from 1 to 100 (Zhou and
Randolph 2009b). Reducing these by the theoretical ratios for
T-bar and ball resistances for Tresca soil leads to a relationship
for T-bar resistance factors of:
1
t
Tbar
S19~ N
(27)
so ranging from a hypothetical 18 for non-softening soil, to a
lower limit of 9 for ultra-high sensitivity. For typical
sensitivities of offshore sediments in the range of, say, 3 to 10,
the resulting resistance factors would lie between 12 and 9.9.
Values above or below this range imply respectively higher or
lower rate dependency, or sensitivities outside 3 to 10. The form
of variation of resistance factor with soil sensitivity is quite
similar to that observed experimentally by DeJong et al. (2011)
for sensitivities up to about 10, beyond which the experimental
resistance factors (based on field vane strength data) continued
to fall, with a lower limit of around 6.
5.1
Field measurement of consolidation coefficient
The consolidation characteristics of seabed sediments determine
the time scale of consolidation following foundation
installation, or after cyclic loading that may have caused partial
liquefaction. They also determine whether continuous motion,
such as a penetrometer test or the axial and lateral movement of
a pipeline during thermal buckling, occurs in a drained or
undrained manner. It is therefore important to measure the
consolidation coefficient, c
v
, either from laboratory testing or
from field dissipation tests following piezocone penetration.
Piezocone dissipation tests are commonly interpreted by
fitting the excess pore pressure decay to the numerically
determined consolidation solution of Teh and Houlsby (1991).
This may be approximated (as in Equation (1)) as
b
50
ref
T/T1
1
~
u
u U
(28)
where
u
ref
is the reference excess pore pressure that
corresponds (ideally) to the initial excess pore pressure at the
moment where the piezocone penetration ceases. Time t is
normalised as T = c
v
t/d
cone
2
, and T
50
is the normalised time for
50 % excess pore pressure dissipation. (The notation c
h
is often
used, rather than c
v
, for the consolidation coefficient deduced
from piezocone dissipation tests, to emphasise the primary
direction of pore fluid flow.) As noted earlier, the exponent, b,
is about 0.75, and T
50
may be approximated as 0.061 times the
square root of the rigidity index, I
r
.
Determination of c
v
in this way relies on the penetration
phase to have occurred under undrained conditions, for which it
is necessary know the consolidation coefficient! Some insight
into this circular argument may be obtained by the simple
assumption that pore pressure dissipation is a continuous
process, some of which may occur during the penetration phase,
and the rest of which continues, once the piezocone is halted,
during the (subsequent) dissipation phase. This is a slight
simplification, but it has proved useful in identifying limits on
the reliability of interpreting dissipation tests (DeJong and
Randolph 2012).
Excess pore pressure data from numerical analysis (e.g. Yi et
al. 2012) and experiments (Randolph and Hope 2004, Schneider
et al. 2007), where the piezocone was installed at different rates
to span drained to undrained conditions, can be fitted by
c
50
ref
0p
V/V1
1
~
u
u
(29)
where
u
p0
is the excess pore pressure during the penetration,
which in the field situation would become the initial excess pore
pressure for a dissipation test. The normalised velocity, V, is
defined as V = vd
cone
/c
v
, and V
50
is the normalised velocity at
which
u
p0
is 50 % of the reference ‘undrained’ excess pore


