93
Honour Lectures /
Conférences honorifiques
Proceedings of the 18
th
International Conference on Soil Mechanics and Geotechnical Engineering, Paris 2013
shown in Figure 8, for a case of a surface foundation on
homogeneous soil, with resultant horizontal loading at 60 º to
the x-axis. The failure envelopes and FE results correspond to
five different torsion mobilisation ratios. The quality of fit is
reasonably good, although with slight over prediction of the
maximum moment capacity at high levels of torsion.
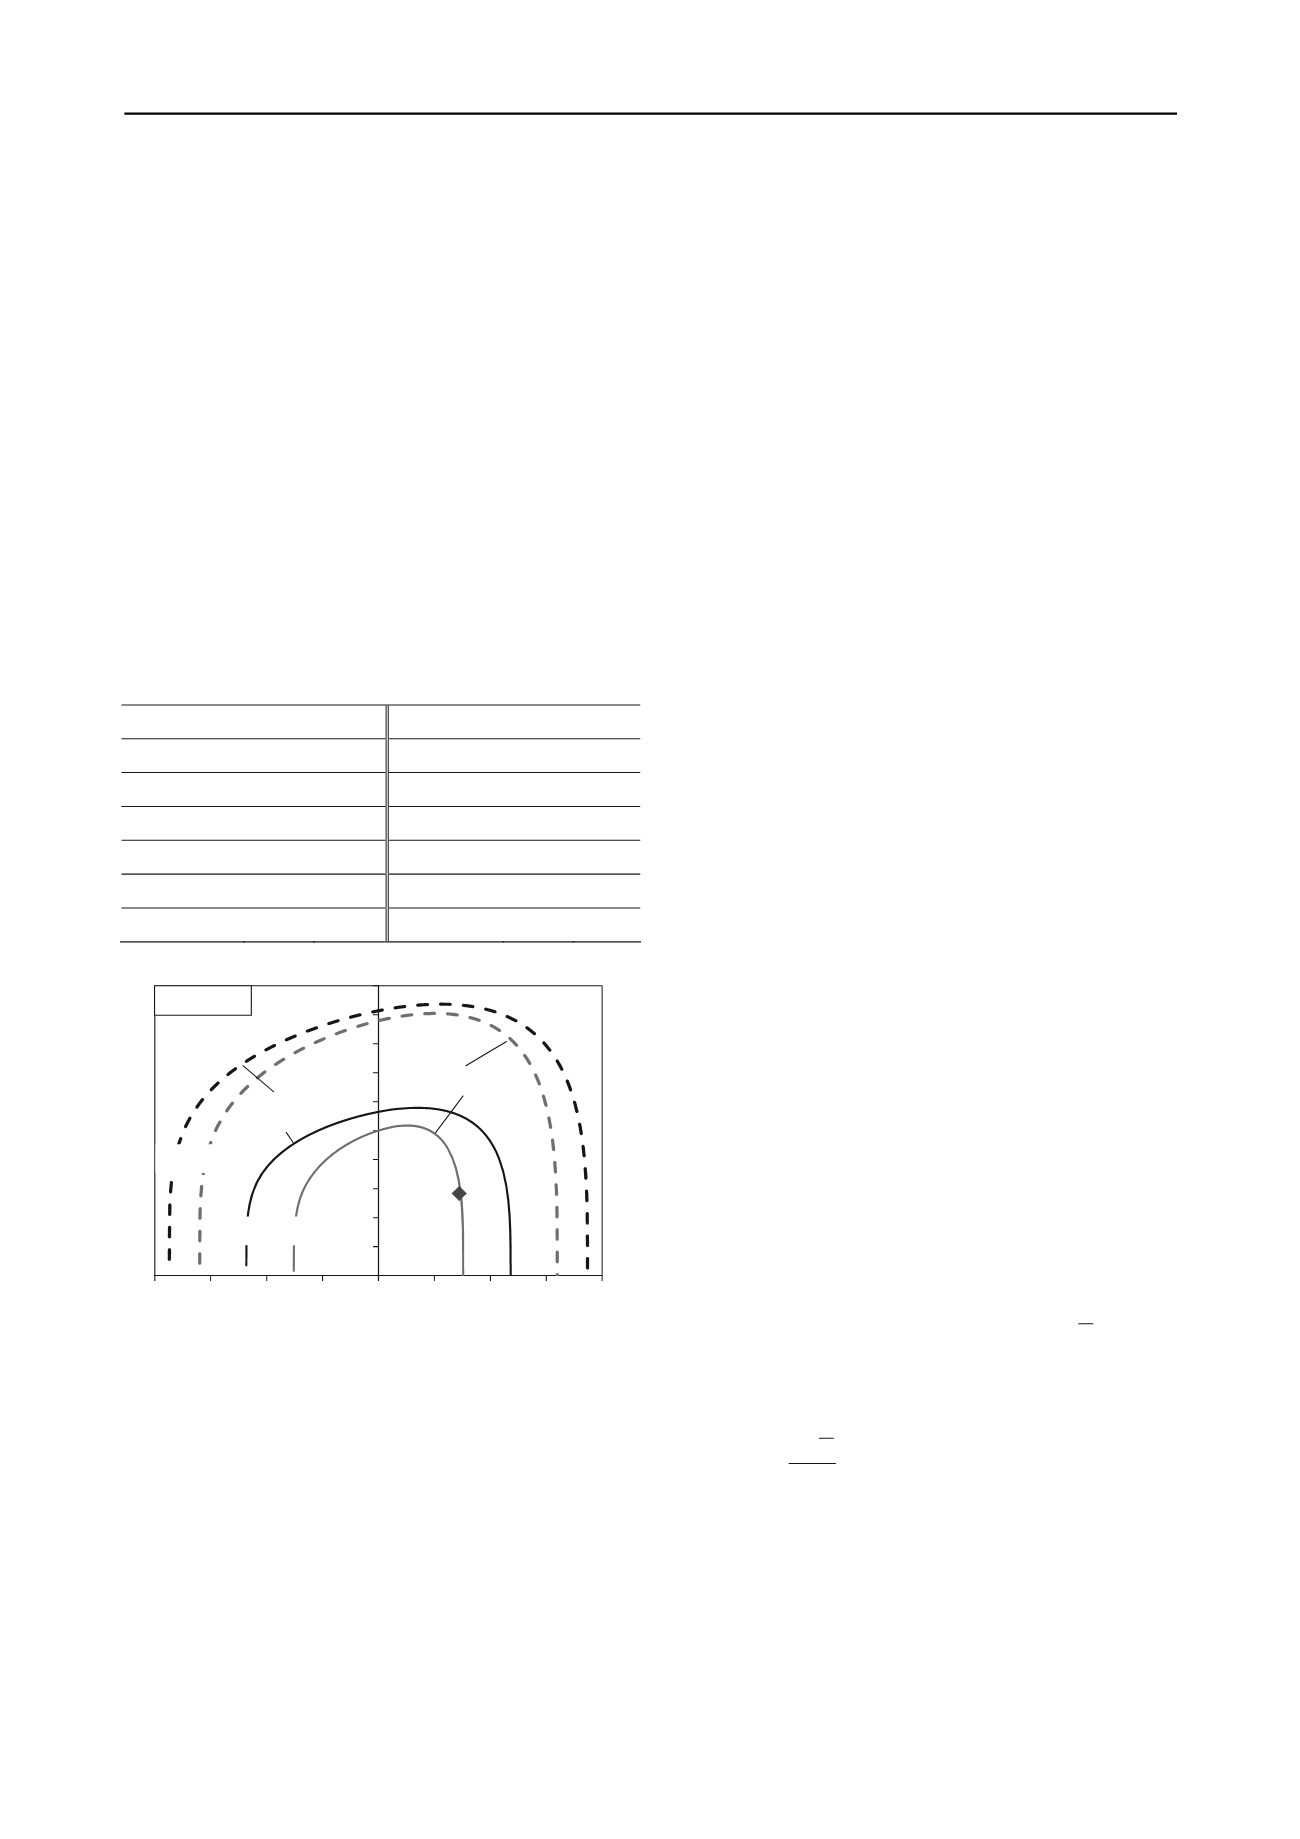
An example foundation analysis following this approach is
presented here, with input data (including factored design loads)
tabulated in Table 3 and the resulting failure envelopes and
design loading shown in Figure 9. Failure envelopes based on
unfactored shear strengths are shown as dashed lines, with the
outer (black) envelope corresponding to zero torsion, and the
inner (red) envelope after allowing for the applied torsion of
2100 kNm. The solid lines represent failure envelopes after
reducing the shear strength by the material factor of 1.58 that is
just sufficient to cause failure; again the outer and inner of these
two envelopes represent situations with zero torsion and the
actual design torsion. The increased mobilisation ratios for v
and t, due to factoring the shear strength, reduce the maximum
values of H and M for the failure envelopes that allow for the
applied torsion by greater factors, respectively 2.1 and 1.8.
Table 3 Input data for example subsea system foundation
Parameter
Value
Units
Design loads Value
Units
Width, B
8
m
Vert. load, V 1200
kN
Length, L
16
m
Load, H
x
200
kN
Skirt, d
0.6
m
Load, H
y
300
kN
Strength, s
um
5
kPa
Moment, M
x
1500
kNm
s
u
gradient, k
2
kPa/m
Moment, M
y
-2400
kNm
Skirt friction
0
Torsion, T
2100
kNm
0
1000
2000
3000
4000
5000
6000
7000
8000
9000
10000
-1000 -750 -500 -250 0 250 500 750 1000
Resultant moment, M (kNm)
Resultant horizontal load, H (kN)
T = 2100 kNm
Design
point
Zero
torque
Unfactored s
u
Factored s
u
V = 1200 kN
Figure 9 Failure envelopes and design loading for example application.
From a design perspective, optimising the size of shallow
foundations for subsea systems requires more sophisticated
analysis than the conventional approach for bearing capacity
followed in offshore design guidelines. The use of failure
envelopes for combined V-H-M loading provides a suitable
advance. Depending on the sensitivity of the structure, final
design may well involve detailed 2D or 3D finite element
analysis, but simpler tools are needed to enable initial sizing.
Design using failure envelopes is modular, with the first step
being to evaluate uniaxial failure loads and moments for the
relevant degrees of freedom. For circular foundations in-plane
loading may generally be assumed, with only three degrees of
freedom, unless the torsion is significant. If that is the case, the
horizontal capacity should be reduced to compensate (Finnie
and Morgan 2004, Murff et al. 2010), and possibly the moment
capacity as well. For rectangular foundations all six degrees of
freedom need to be considered.
Generic shapes of failure envelope, based on loads
normalised by their ultimate uniaxial values, are much less
sensitive to foundation shape and embedment ratio, and soil
strength gradient, than are the uniaxial load limits. As such, the
shapes need not necessarily be fine-tuned. The most awkward
shape is the failure envelope in the h-m plane. For planar
loading, the approach described by Gourvenec (2007b) is
therefore attractive, based on generic failure envelopes in v-m
space for different magnitudes of (normalised) horizontal load
eccentricity, m/h.
For rectangular foundations, particularly if relatively lightly
loaded vertically, the approach outlined in Table 2 offers a
simple way forward, maintaining a modular concept where the
various interaction diagrams may be fine-tuned to suit particular
conditions, if these deviate significantly from those considered
by Feng et al. (2013). For example, interaction diagrams based
on sustained tensile stresses could be replaced by equivalent
ones based on a zero tension condition.
The increasing complexity of subsea systems brings the
potential for higher service loads due to thermal and pressure-
driven movements of the pipeline and jumper connections. The
cost incentive to limit the overall foundation dimensions is
therefore driving innovation, both in analysis methods but also
in the foundation configuration itself. One such innovation is to
include pin-piles at the foundation corners, which can increase
the sliding and torsional capacity by a factor of 3 or 4. A simple
design approach for such a hybrid foundation has recently been
developed, following lower bound principles (Dimmock et al.
2013), and validated through physical model tests (Gaudin et al.
2012). An alternative approach is to design the foundation to
slide, hence reducing the magnitudes of horizontal load and
moment (Bretelle and Wallerand 2013). Both of these strategies
still rely on failure envelopes for different combinations of load
and moment, either to ensure adequate capacity, or to evaluate
the displacement and rotation paths for sliding foundations.
4 USE OF FAILURE ENVELOPES FOR ANCHORS
In most design applications, failure envelopes are used to
establish safe load combinations. However, they may also be
used to model the kinematic response during continuous failure.
The concept was applied to predict the trajectory of drag
embedment anchors by Bransby and O’Neill (1999), success-
fully simulating centrifuge model tests (O’Neill et al. 2003).
In soft sediments, drag anchors embed to several times the
length of their flukes, advancing approximately parallel to the
flukes and gradually rotating until the flukes approach the
horizontal, signifying reaching their ultimate penetration depth.
The anchor chain forms a reverse catenary through the soil,
described by an analytical solution expressed in terms of the
chain tension, T, and average soil resistance,
Q
, between
mudline and padeye depth (Neubecker and Randolph 1995).
Critical is the angle change between mudline and padeye, which
may be approximated as
a
a
2
0
2
a
T
Qz2~
(23)
where subscripts ‘a’ and ‘0’ correspond to the anchor padeye
and mudline respectively.
Solutions for the final anchor embedment depth and ultimate
capacity were initially obtained using simplified limit
equilibrium (Neubecker and Randolph 1996) or upper bound
(Aubeny et al. 2005, 2008) approaches. The use of a full failure
envelope to obtain the relative motions, parallel and normal to
the anchor fluke, and rotation, represented a more rigorous
treatment.


