3244
Proceedings of the 18
th
International Conference on Soil Mechanics and Geotechnical Engineering, Paris 2013
0.0
10.0
20.0
30.0
40.0
50.0
60.0
70.0
80.0
90.0
100.0
0.0
1.0
2.0
3.0
4.0
5.0
6.0
7.0
8.0
9.0
ShearStress (kPa)
HorizontalDisplacment (mm)
10% Cu Slag
50kPa
100kPa
150kPa
masses by acting as outlets for ground water to flow out. A key
attribute of sand drains is to have very high hydraulic
conductivities so that there is minimal resistance to water
flowing them. High void ratios generally translate into high
hydraulic conductivity thus, a material with high void ratio
would be ideal for used in such drains.
The particle size gradation curves suggest that the hydraulic
conductivity of the mixes should not deviate too much from that
of the original sand. A series of constant head test were carried
out on the each mix in order to check if this was true.
0.0
10.0
20.0
30.0
40.0
50.0
60.0
70.0
80.0
90.0
100.0
0.0
1.0
2.0
3.0
ShearStress (kPa)
Horizont
20% Cu Slag
4.0
5.0
6.0
7.0
8.0
9.0
alDisplacement(mm)
50kPa
100kPa
150kPa
The permeameter was filled with air dried samples of the
copper-sand mix by dropping the material through a funnel
from a fixed height. Special care was taken during the
preparation of the specimens in order to ensure that they were
comparable and consistent among all the different copper-sand
mixes. The funnel used in this case was one from a “Sand
Cone” test used in estimating field compaction values and it was
placed on top of the permeameter. The funnel was first filled to
the brim and the tap was opened to let all the material fall in to
the permeamter in a single step. This method could be estimated
to produce samples slightly denser than those specified in
ASTM D 4254. The unit weight of the specimen was found by
weighing the permeameter and calculating the volumes
occupied by the material.
Specific gravity of the waste copper slag was found to be 3.7
and that of the sand was around 2.65. The specific gravity of the
copper-sand mixes were calculated as a weighted average based
on the proportions of each component. The void ratio of each
mix was then calculated .As expected, the void ratio are tightly
grouped together, ranging between 0.7 – 0.8. There is a trend
showing a peak void ratio at a mix proportion of 20% copper
slag. However, these small differences in void ratios are not
significant enough to affect the hydraulic conductivity of the
materials as can be seen from
Figure 2
.
0.0
10.0
20.0
30.0
40.0
50.0
60.0
70.0
80.0
90.0
100.0
0.0
1.0
2.0
3.0
4.0
5.0
6.0
7.0
8.0
9.0
ShearStress (kPa)
HorizontalDisplacement (mm)
40% Cu Slag
50kPa
100kPa
150kPa
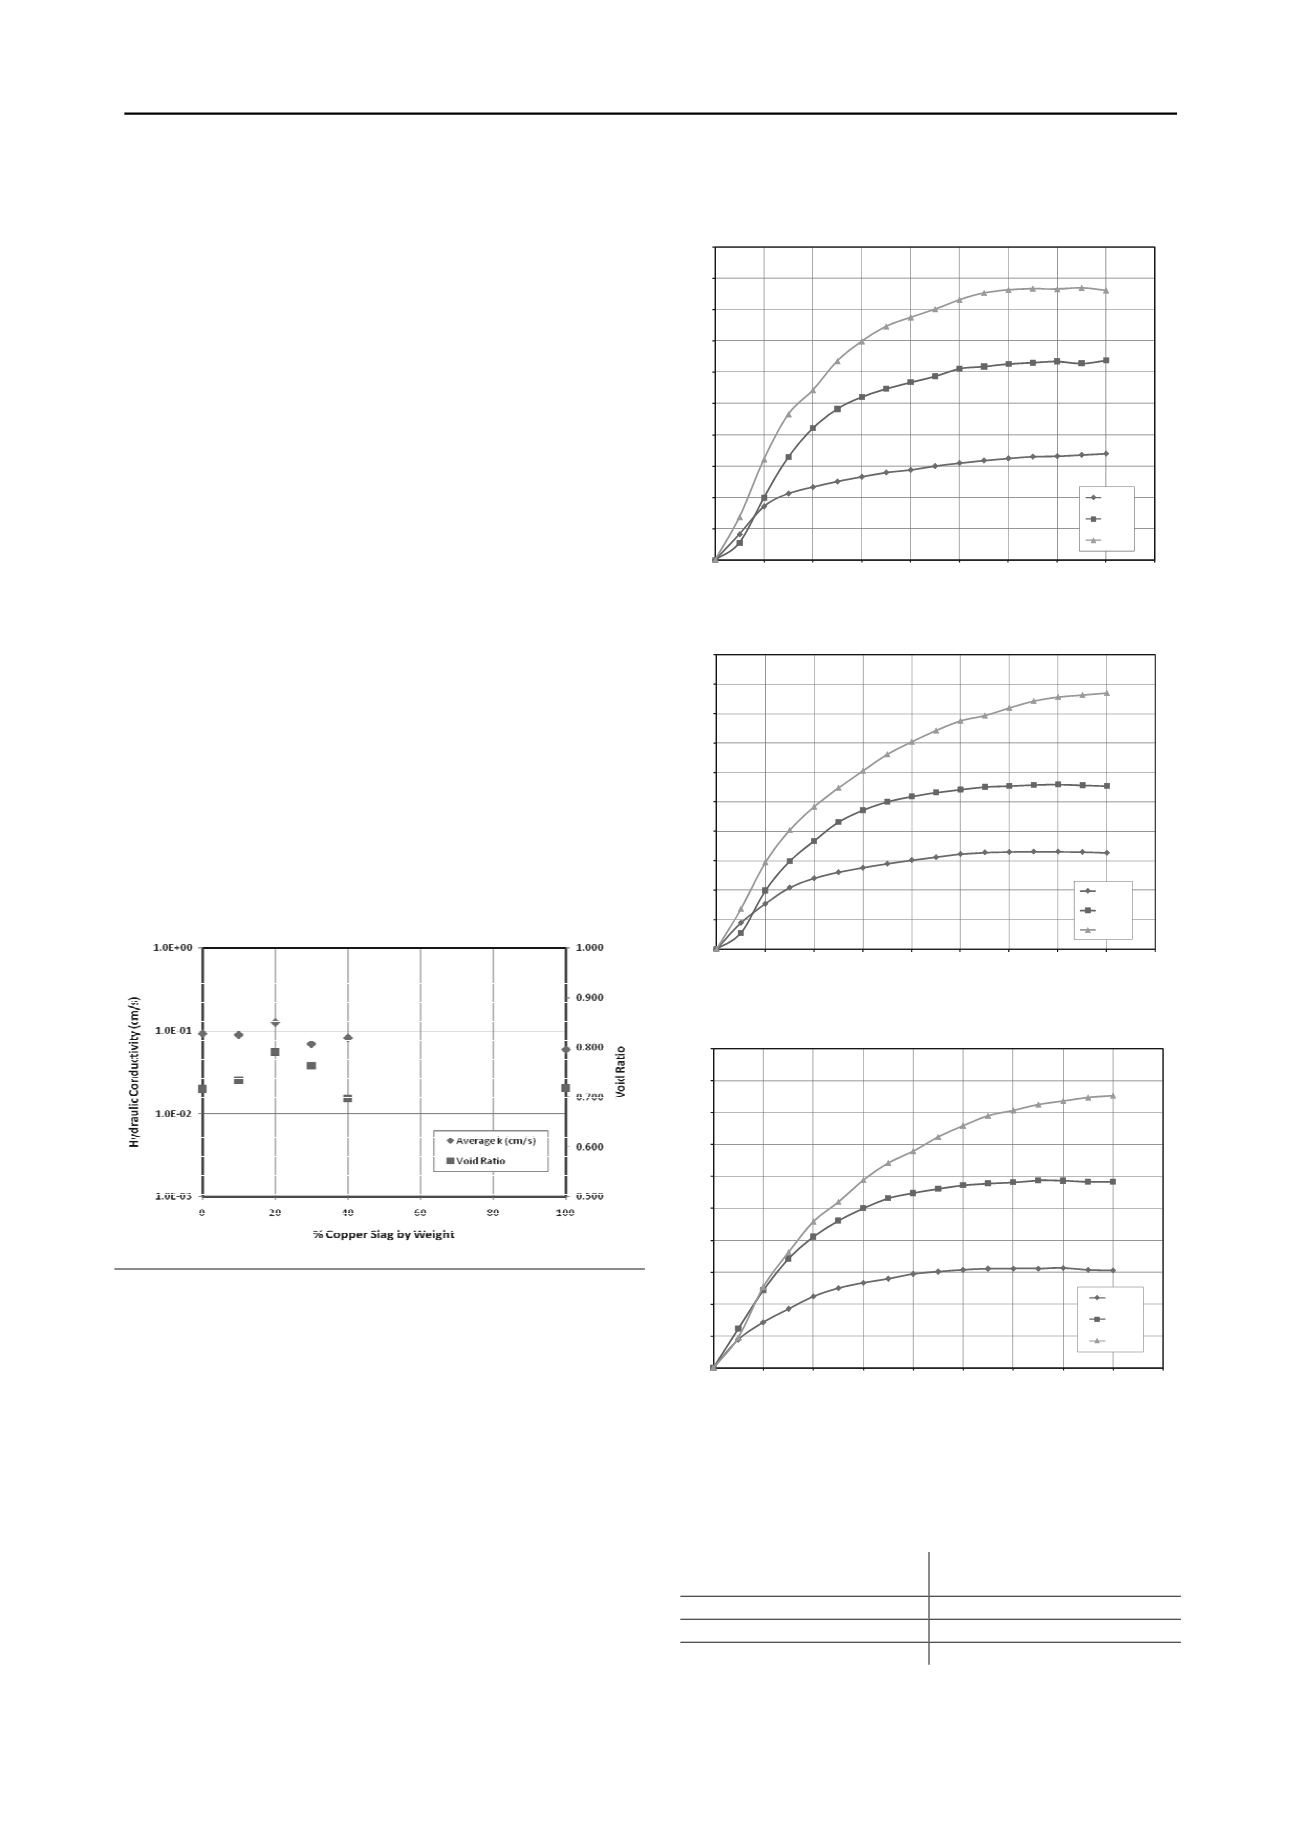
3 SHEAR STRENGTH
The samples which were tested in the direct shear apparatus
were prepared in ‘loose condition’ with no compacting. As
expected, the plots on
Figure 3
are typical of ‘loose’ sand as
they show a gradual gain in shear strength and then flatten out
with no pronounced peak. It can also be seen that the axial
strain required mobilizing maximum shear strength increases
with the increase in the applied normal stress. Figure 6 shows
the summary of Mohr Coulomb failure envelopes for various
copper sand mixes and Table 1 provides friction angles those
mixes.
The direct shear test results show that the addition of waste
copper-slag does not affect the shear strength of the sand. A
friction angle of 30 degrees is typical for a ‘loose’ sand and if
need be, the friction angle can be increased further by
densifying the material.
(a)
(b)
(c)
Table 1: Friction Angles of Copp
Figure 2: Hydraulic Conductivities and Void Ratios for Copper-Sand
Mixes
Figure 3: Direct Shear Test Results on Copper-Sand Mixes
er-Sand Mixes in ‘Loose’ State
es)
% of Copper Slag by
Weight
Friction Angle (degre
10
31.4
20
30.4
40
30.4


