 
          3240
        
        
          Proceedings of the 18
        
        
          th
        
        
          International Conference on Soil Mechanics and Geotechnical Engineering, Paris 2013
        
        
          plastic deformation. The SYS Cam-clay model defines
        
        
          structure, overconsolidation, and anisotropy as the soil skeleton
        
        
          structure, and an evolution rule is introduced that varies them in
        
        
          accordance with the plastic deformation to reproduce the
        
        
          mechanical behavior of natural deposited clay. This study
        
        
          focused on structure and overconsolidation, controlling the ease
        
        
          of change of their states using a degradation index of structure
        
        
          and a degradation index of OCR in accordance with their
        
        
          respective evolution rules (see Table 3), to explain the treated
        
        
          soil as natural deposited clay and the remolded treated soil as
        
        
          remolded soil.
        
        
          Table 1 Physical properties of dredged soil
        
        
          Soil particle density


            ρ


          s
        
        
          [g/cm
        
        
          3
        
        
          ]
        
        
          2.67
        
        
          Natural water content


            w


          n
        
        
          [%]
        
        
          50–110
        
        
          Liquid limit


            w


          L
        
        
          [%]
        
        
          52.5
        
        
          Plastic limit


            w


          p
        
        
          [%]
        
        
          25.1
        
        
          Plasticity index


            I


          p
        
        
          [%]
        
        
          27.4
        
        
          Clay content [%]
        
        
          60
        
        
          Silt content [%]
        
        
          36.6
        
        
          Sand content [%]
        
        
          3.4
        
        
          Mean grain diameter


            D


          50
        
        
          [mm]
        
        
          0.002
        
        
          2 REPRODUCTION OF  THE MECHANICAL BEHAVIOR
        
        
          OF TREATED SOIL WITH SYS CAM-CLAY MODEL
        
        
          2.1


            Physical properties of dredged soil and treated soil


            mixture conditions


          Table 1 shows the physical properties of PI dredged soil.
        
        
          Almost all of the soil is fine fraction with a high natural water
        
        
          content, and it does not achieve the required strength. Also,
        
        
          Table 2 shows the mixture conditions of the treated soil. In this
        
        
          study, the mixture conditions were assumed to be a water
        
        
          content


            w


          =120%, cement contents of


            C


          =30, 50, and 70 kg/m
        
        
          3
        
        
          ,
        
        
          and 28 days’ curing in order to ensure fluidity and strength for
        
        
          the assumed Pneumatic Flow Method (Coastal Development
        
        
          Institute of Technology 2008).
        
        
          Table 2 Mixture conditions used in the comparison of cement content
        
        
          Dredged soil water
        
        
          content


            w


          0
        
        
          [%]
        
        
          Cement content


            C


          [kg/m
        
        
          3
        
        
          ]
        
        
          Water-cement ratio


            W/C


          120
        
        
          30
        
        
          50
        
        
          70
        
        
          25.2
        
        
          15.0
        
        
          10.6
        
        
          10
        
        
          –1
        
        
          10
        
        
          0
        
        
          10
        
        
          1
        
        
          10
        
        
          2
        
        
          10
        
        
          3
        
        
          10
        
        
          4
        
        
          10
        
        
          5
        
        
          1.6
        
        
          2
        
        
          2.4
        
        
          2.8
        
        
          3.2
        
        
          3.6
        
        
          4
        
        
          Vertical stress
        
        
          σ
        
        
          v
        
        
          (kPa)
        
        
          Specific volume


            v


          Treated soil
        
        
          Remolded treated soil
        
        
          Dredged soil
        
        
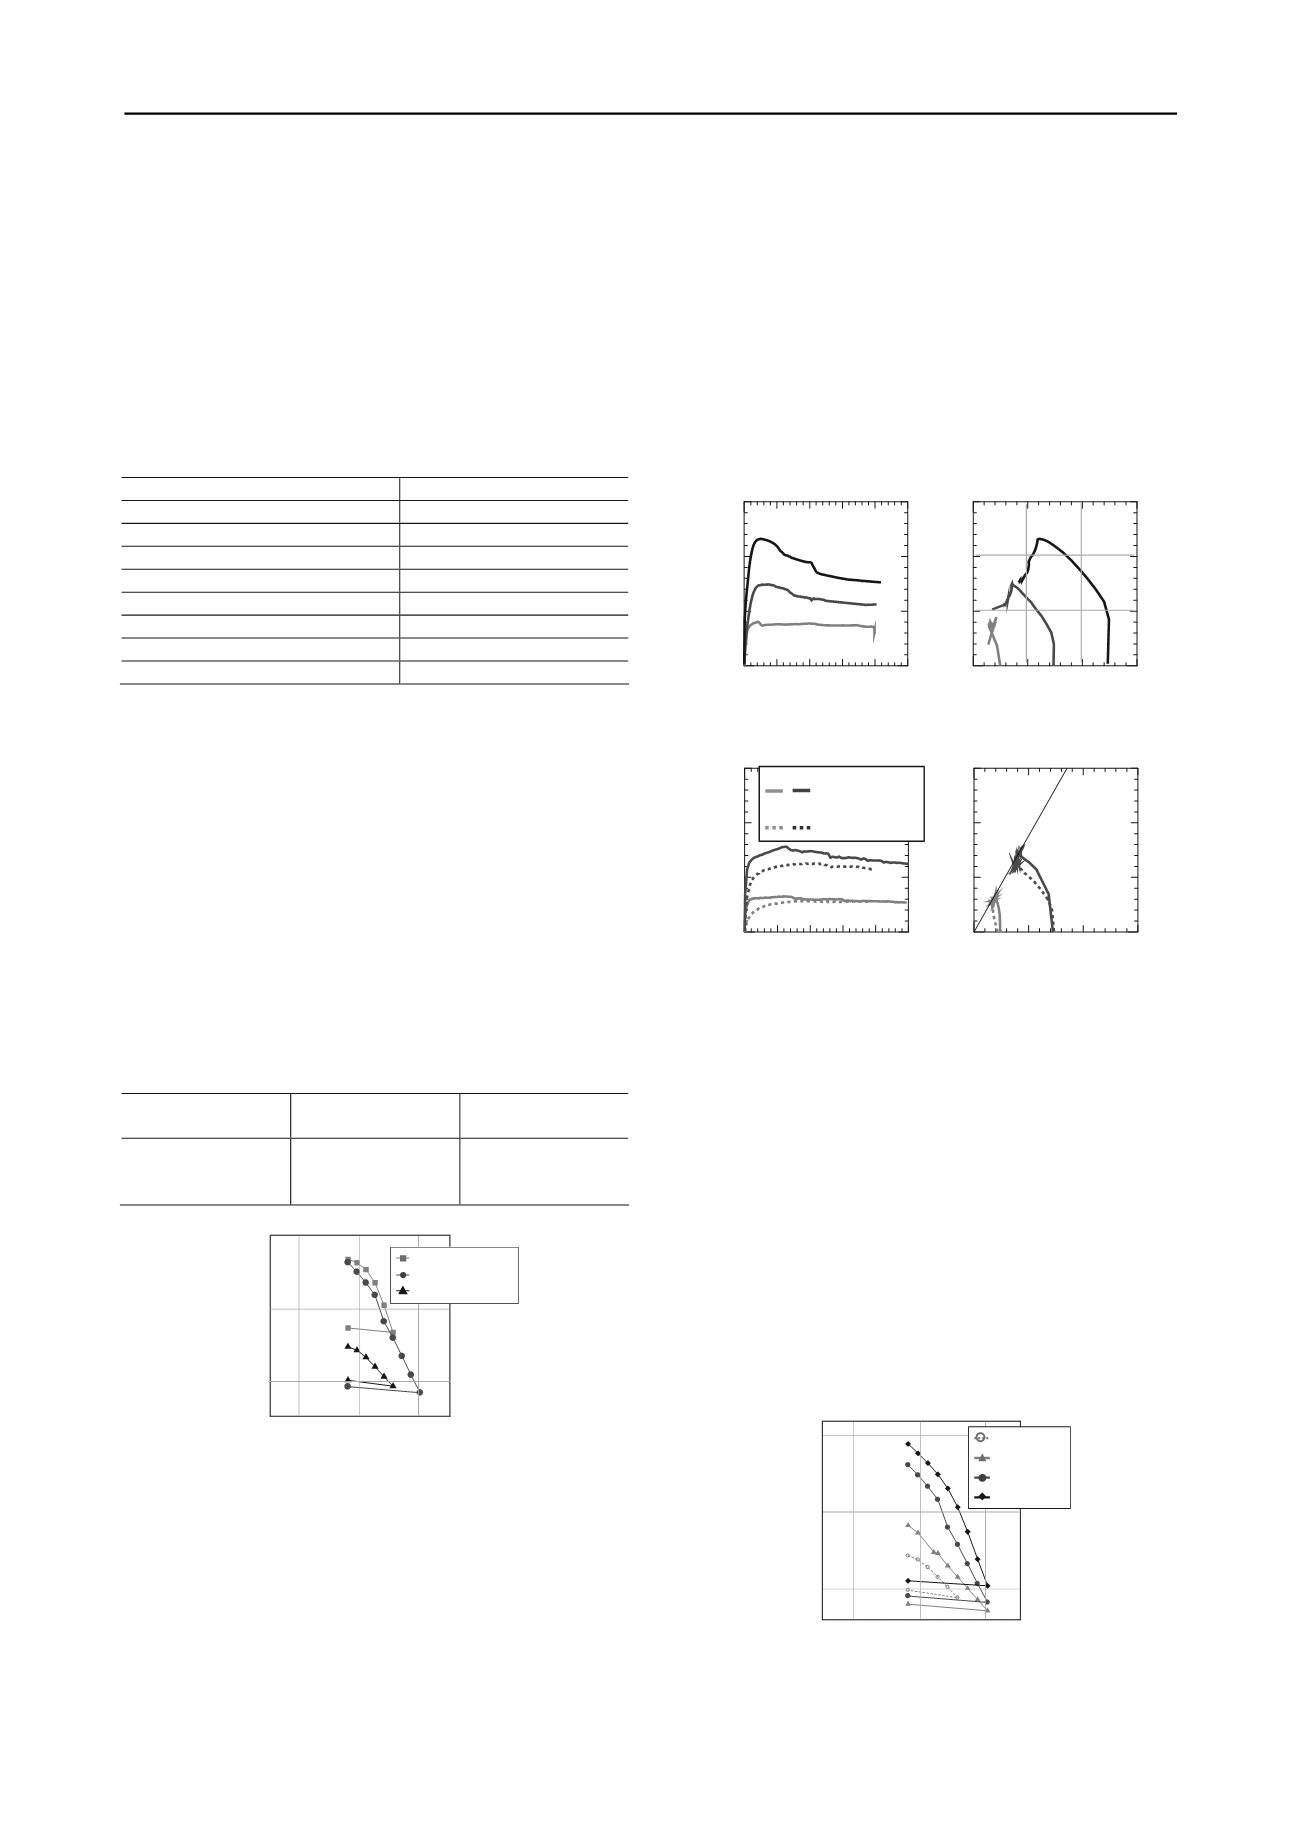
          Figure 2. Comparison of uniaxial compression properties of treated soil,
        
        
          remolded treated soil, and dredged soil
        
        
          2.2


            Mechanical behavior of treated soil (C=50 kg/m


            3


            ) and


            remolded treated soil and material constants


          Fig. 2 shows the oedometer test results for treated soil and
        
        
          remolded treated soil with C=50 kg/m
        
        
          3
        
        
          , together with the results
        
        
          for dredged soil. Compared with dredged soil, treated soil has a
        
        
          high initial specific volume, and as a result of cement addition,
        
        
          it maintains the high specific volume state up to a certain
        
        
          vertical stress. When the vertical stress exceeds a pseudo
        
        
          consolidation yield stress, a high compressibility is exhibited.
        
        
          Compared with the remolded treated soil, there is a certain
        
        
          amount of structure up to the pseudo consolidation yield stress,
        
        
          and when the vertical stress increases further, it gradually
        
        
          approaches the compression line of the remolded treated soil.
        
        
          Fig. 3 shows the CU triaxial test results for the treated soil, and
        
        
          Fig. 4 shows the results for the remolded treated soil. The
        
        
          behavior exhibited in Fig. 3 resembles the behavior of
        
        
          overconsolidated and high structured clay (Asaoka et al. 2002).
        
        
          As shown in Fig. 4, the behavior of remolded treated soil
        
        
          resembles the behavior of dredged soil. However, the treated
        
        
          soil has a specific volume that is distinctly higher than that of
        
        
          dredged soil, so in Figs. 2 and 4, it is considered that remolded
        
        
          treated soil is a material that is different from dredged soil.
        
        
          0 5 10 15 20 25
        
        
          0
        
        
          200
        
        
          400
        
        
          600
        
        
          0
        
        
          200 400 600
        
        
          0
        
        
          200
        
        
          400
        
        
          600
        
        
          Axial strain


            a


          (%)
        
        
          Deviator stress


            q


          (kPa)
        
        
          Mean effective stress


            p


          (kPa)
        
        
          Deviator stress


            q


          (kPa)
        
        
          Figure 3. Consolidated undrained triaxial test results for treated soil
        
        
          0 5 10 15 20 25
        
        
          0
        
        
          200
        
        
          400
        
        
          600
        
        
          0
        
        
          200 400 600
        
        
          0
        
        
          200
        
        
          400
        
        
          600
        
        
          Axial strain


            a


          (%)
        
        
          Deviator stress


            q


          (kPa)
        
        
          Mean effective stress


            p


          (kPa)
        
        
          Deviator stress


            q


          (kPa)


            q


          =M


            p


          Remolded
        
        
          treated soil
        
        
          Dredged soil
        
        
          Figure 4. Consolidated undrained triaxial test results for remolded
        
        
          treated soil
        
        
          2.3


            Reproduction of the mechanical behavior of 3 treated


            soils with different cement contents using the SYS Cam-


            clay model


          Treated soil was produced under the mixture conditions shown
        
        
          in Table 2, and mechanical tests were carried out on them and
        
        
          the remolded treated soil. Fig. 5 shows the results of oedometer
        
        
          tests on remolded treated soil. For all cement contents, the
        
        
          behavior was similar to that of remolded normally consolidated
        
        
          soil, and as the cement content increased, the slope of the NCL


          and the intercept N on the NCL increased. Fig. 6 shows the
        
        
          CU test results for remolded treated soil. For each of the cement
        
        
          contents, the behavior was similar to that of remolded soil, and
        
        
          differences in cement content did not cause a major change in
        
        
          the Critical state constant M. Based on the test results, the
        
        
          elasto-plastic parameters in accordance with the differences in
        
        
          cement content were assigned, as shown in Table 3.
        
        
          10
        
        
          –1
        
        
          10
        
        
          0
        
        
          10
        
        
          1
        
        
          10
        
        
          2
        
        
          10
        
        
          3
        
        
          10
        
        
          4
        
        
          10
        
        
          5
        
        
          1.6
        
        
          1.8
        
        
          2
        
        
          2.2
        
        
          2.4
        
        
          2.6
        
        
          2.8
        
        
          3
        
        
          3.2
        
        
          3.4
        
        
          3.6
        
        
          3.8
        
        
          4
        
        
          4.2
        
        
          Verticalstress
        
        
          σ
        
        
          v
        
        
          (kPa)
        
        
          Specific volume


            v


          Specific olume


            v


          10 10 10 10
        
        
          Vertic stress
        
        
          σ
        
        
          v
        
        
          (kPa)
        
        
          浚渫土
        
        
          C=70kg/m
        
        
          3
        
        
          C=50kg/m
        
        
          3
        
        
          C=30kg/m
        
        
          3
        
        
          Dredged soil
        
        
          Figure 5. Standard consolidation test results for 3 remolded treated soils