3233
Technical Committee 307 /
Comité technique 307
In this series, sand boxes 30 cm wide, 30 cm long, and 50 cm
high were fitted with a bulb for supplying water, located 3 cm
from the bottom. Model ground 30 cm high was constructed of
a mixture of GBFS and PBFS with 50% relative density. This
was saturated with artificial sea water at the beginning of the
test. Tests were run under static water and flowing water
conditions. In the static water case, the pore water was never
changed during the experiment. In the flowing water case, a
volume of water equal to the volume of the voids in the ground
was supplied slowly from the bottom of the ground once every
three days. Curing continued for two months at a constant
temperature of 20 degrees centigrade. After curing, the bearing
strength distribution of the ground was measured using a soil
hardness meter, and was converted to unconfined compression
strengths.
The results show that the HMT-treated material subjected to
static water conditions was the strongest. The material that had
undergone HMT was weaker when cured in flowing water.
However, for the PHMT-treated material, the opposite was true.
With flowing water the PHMT material was stronger than the
HMT material, meaning that PHMT has a higher potential to
solidify GBFS than HMT under non-static water conditions.
3.4
Improving resistance to separation during construction
using PHMT
For this series of experiments, we used GBFS with the
following physical properties:
s
= 2.808 g/cm
3
,
dmin
= 1.199
g/cm
3
, and
dmax
= 1.562 g/cm
3
. The median particle diameter
(D
50
) was 0.74 mm. The physical properties of the PBFS were
s
= 2.890 g/cm
3
, with 5000 to 7000 cm
2
/g of specific surface
area. Artificial seawater was used as pore water.
As the GBFS and PBFS may separate when the mixture is
poured onto the seabed, PHMT was used to counter this
problem. With PHMT, some of the PBFS attaches to the GBFS
granules, making the mixture more resistant to separation and
decreasing the turbidity the mixture causes in water.
We mixed 10% seawater and 7.5% by weight of PBFS with
GBFS and cured the mixture for a designated period in air. We
measured the turbidity it caused after 0, 3, 7, 10, and 14 days of
curing. In each test, about 0.460 N of the PHMT mixture was
poured into 1000 ml of pure water and stirred well, then left to
sit for 30 min. A turbidity meter was used for measurements.
0
500
1000
1500
2000
2500
0 2 4 6 8 10 12 14
Suspended PBFS
concentration(mg/ℓ)
Curing time (days)
Just after mixing
30 min after mixing
Figure 5. Change in suspended PBFS concentration with curing time.
Figure 5 shows how the suspended material concentration
changed with curing time. The level just after mixing decreased
to one-fourth of its initial value after 7 days of curing. The
concentration 30 min after mixing became negligible after 7
days of curing.
A mixture of GBFS and PHMT is thus shown to be effective
in reducing the amount of material separation during
construction.
3.5
Effects of changing from sea water to fresh water on the
solidification of PHMT-treated GBFS
Here, we address issue (5) described above. The follow-up
survey about GBFS used as backfill noted in the introduction
revealed that the pore water in the GBFS layer changed
completely from seawater to fresh water over a period of 4
months (Kikuchi et al. 2005). This phenomenon occurs because
the mean ground water level is higher than the mean sea level
and rainfall supplies fresh water. Figure 1 shows that GBFS
mixed with PBFS in seawater solidified in a month. With this in
mind, we checked the effect of a pore water transition in a series
of laboratory experiments.
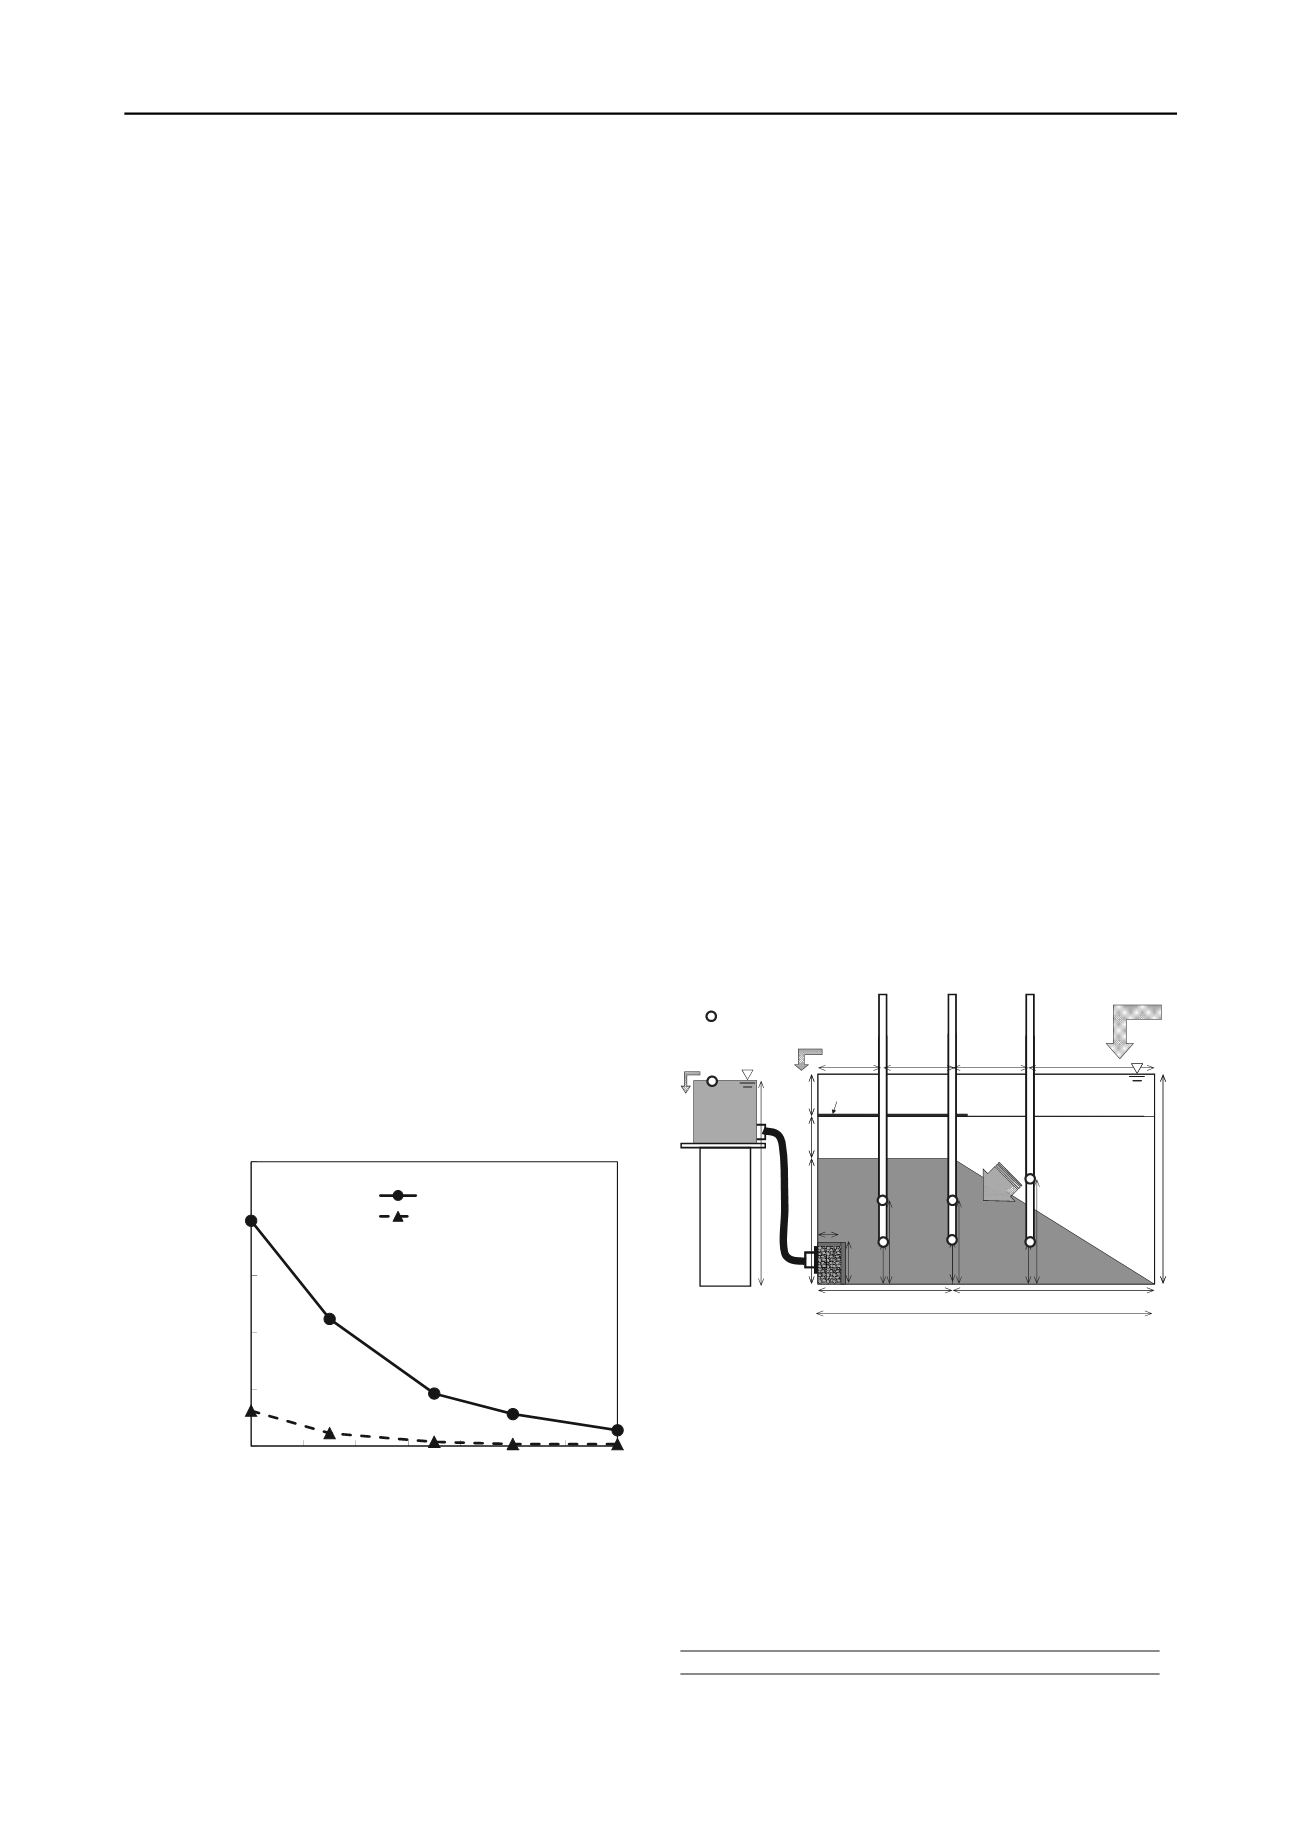
Figure 6 shows how the experiment was set up. The box
holding the sand was 800 mm long, 500 mm high, and 500 mm
wide. We used PHMT cured for 7 days, made following the
procedure described in section 3.2. The PHMT layer was made
when wet and was covered by the sand layer. We used silica
sand #4 (
s
= 2.644 g/cm
3
,
dmin
= 1.342 g/cm
3
, and
dmax
= 1.618
g/cm
3
). The relative densities of the PHMT and sand were 50%.
The water used to make the layers was artificial seawater,
except for case 4 (Table 2.), in which fresh water was used. The
shape of each layer is shown in Fig. 6. After making the model
ground, 6 standpipes were installed at the positions marked No.
1, No. 2, and No. 3 to collect pore water. Two pipes were
installed at each location to collect water from different depths.
The open circles in Fig. 6 show the points where pore water was
collected. Water was supplied as shown in the upper right part
of the figure at a rate of 6
l
per day. Effluent flowed from the
bottom of the apparatus as shown in the figure. Since the void
space in the model ground layer was about 84
l
, the hydraulic
retention time of the water in the apparatus was 14 days. Each
experiment was conducted at 20 degrees centigrade. As the
room was not perfectly temperature-controlled, its temperature
was somewhat affected by the outside temperature.
Influent
500
320
Effluent
800
480
150 170 180
300
100
200
200
100
100
250
300
100
100
Effluent
490
Silica sand
#4
No.1 No.2 No.3
:Measuring point
100
50
(Depth: 500)
Unit: mm
Impermeable liner
GBFS(PHMT)
Figure 6. Experimental setup
During the experiment, pore water was collected from each
point at designated times, and pH and salinity were measured.
After 8 weeks, the strength of the PHMT-treated GBFS was
measured with a Yamanaka soil hardness meter (Kikuchi et al.
2010). About 2000 strength measurements were made in each
case. The data collected were converted to unconfined
compression strengths using a relationship between strength and
hardness determined before the experiment.
Table 1 shows the types of water supplied in each case.
Table 1. Experiment conditions
Case
Condition
Case 1
Sea water supplied for 8 weeks
Case 2
Sea water supplied for 6 weeks, then pure water
supplied for 2 weeks


