3229
Technical Committee 307 /
Comité technique 307
probably did not play a role, as it likely did for Tokyo Bay B.
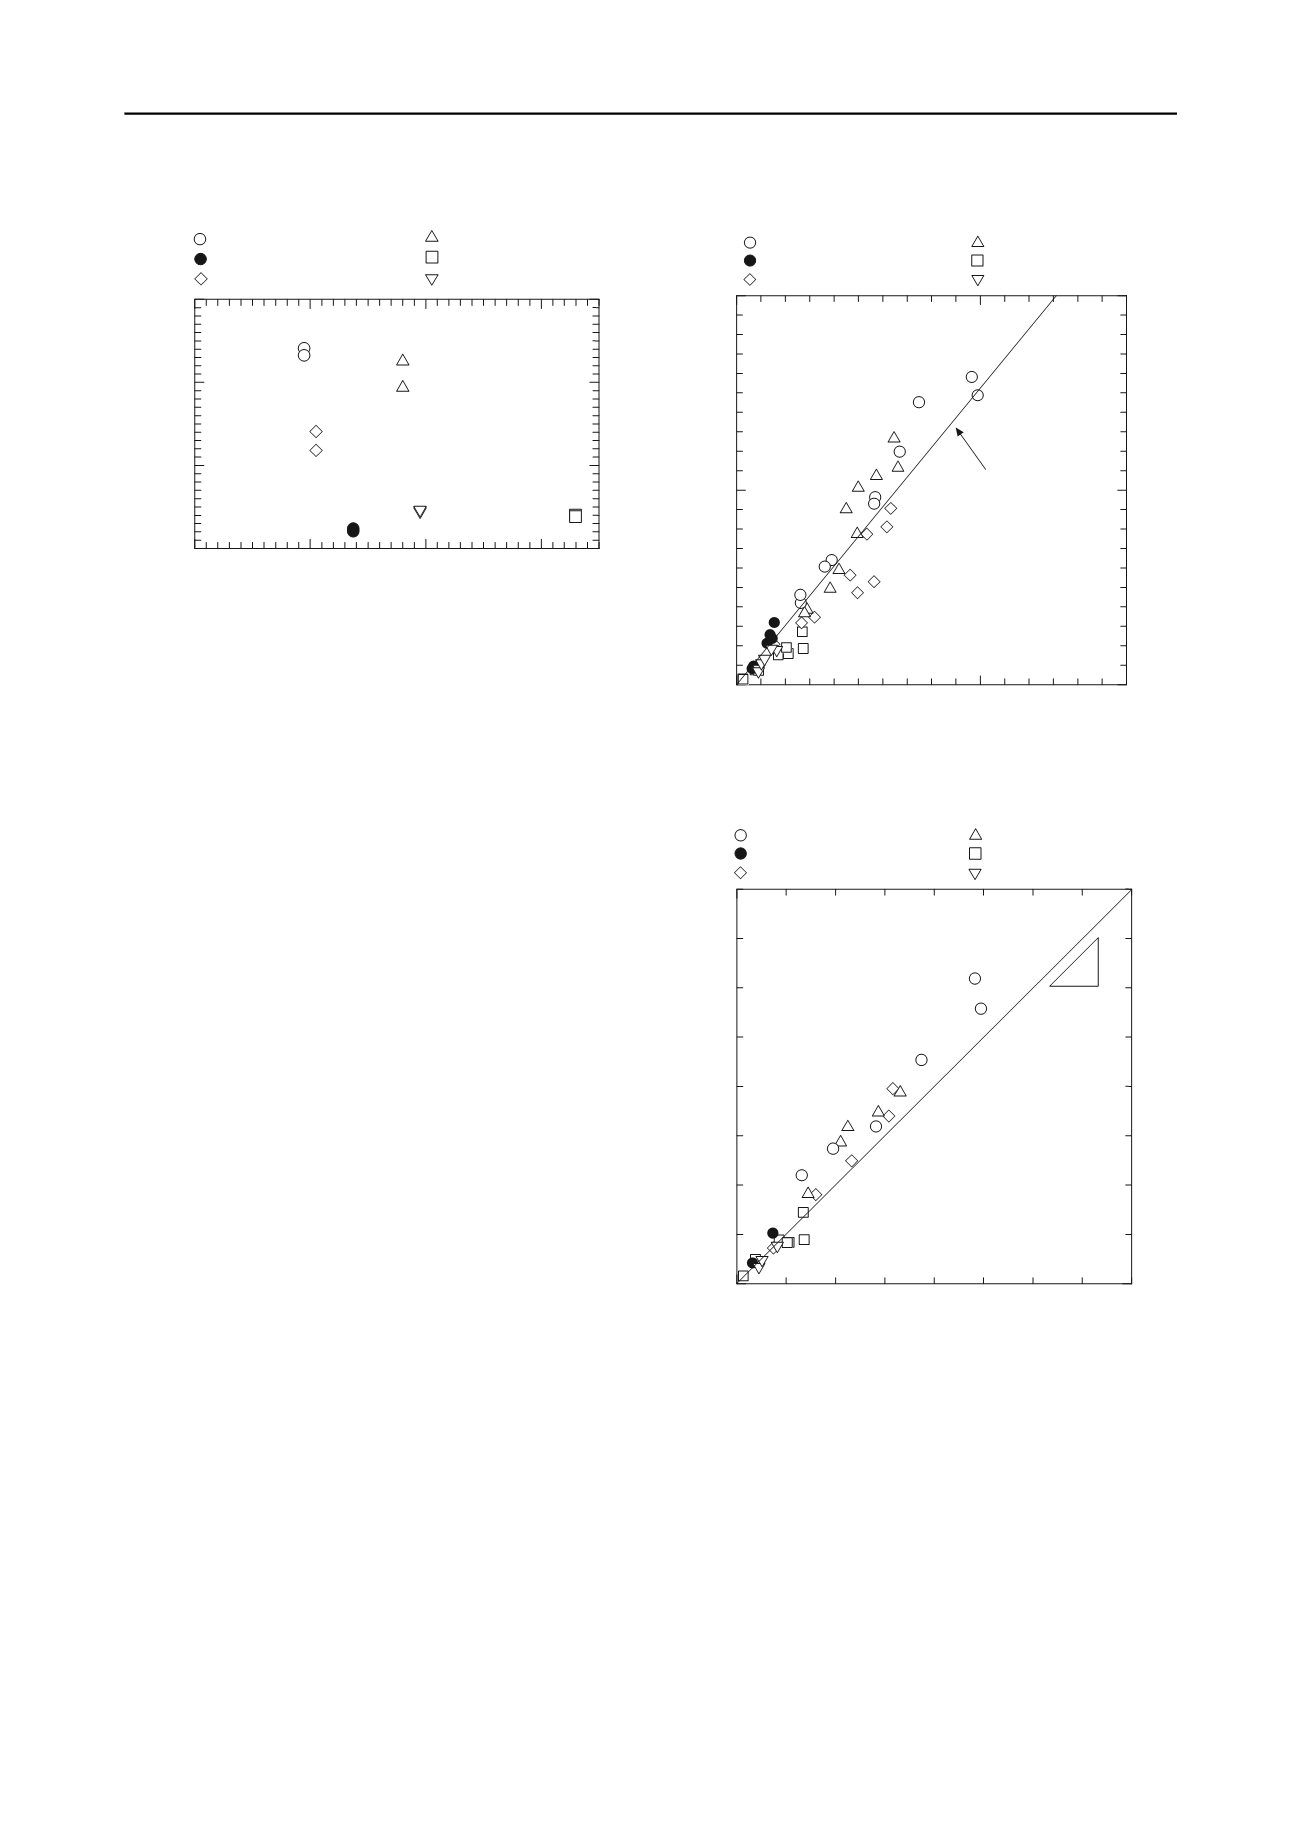
Figure 2 shows the relationship between the flow values of
the SGM specimens and
q
u
on the curing period of 28 day.
While it was believed that there is some relationship between
flow values and soil strength, the lower
q
u
value of Tokyo Bay
B than that of other specimens suggests that there is some
relationship between the strength and the low pH level of Tokyo
Bay B.
Figure 3 shows the relationship between
G
vh
and
q
u
. It is
evident from the graph that there is a strong correlation between
G
vh
and
q
u
obtained from all the SGM specimens, with an
approximately linear relationship between the two variables in
each one of them. A previous study showed there is a linear
relationship between
q
u
and Young’s modulus in the small
strain range of cement-treated sand, while another study
demonstrated that there is a linear relationship, as it was found
in this study, between the elastic shear modulus and the stiffness
of cement-treated soil where cohesive soil was used as the
source soil (Shibuya et al. 2001, Seng and Tanaka 2011). Based
on these results, the relationship obtained in this study is
believed to be a characteristic common to cement-treated soil.
While changes to
G
vh
and
q
u
with the increase of curing days
varied greatly from one soil type to another, it was confirmed
that the relationship between the variables fell within a certain
range, regardless of the type of source soil used. From this it
can be concluded that in air-foam treated lightweight soils,
where the amount of cement additive and the required
t
are
approximately the same, the relationship between
G
vh
and
q
u
is
approximately the same, regardless of the type of source soil.
Figure 4 shows the relationship between
G
vh
and
G
hh
obtained from the shear wave velocity propagating in horizontal
and vertical directions. The slope is virtually uniform,
regardless of the number of curing days and the soil type.
However, the slope is smaller than that of natural clay deposits
compacted to
K
0
(Kawaguchi et al. 2008). Thus, a relatively
uniform distribution of nearly spherical air foam inside SGM
(Watabe et al. 2004) and a relatively loose (random) state in
which the source soil has stabilized are believed to have made
SGM an isotropic material in terms of stiffness.
3.2
Micro structure observation of the SGM specimen
The microscopic structure of SGM was observed using the SEM
in order to examine the factors affecting the strength
development of the SGM specimens from the changes to the
internal structure with the passage of curing time.
Photos 1 show the internal structures of Tokyo Bay A, on the
curing period of 3 (1a) and 182 days (1b), and Tokyo Bay B, on
the curing period of 28 (2a) and 182 days (2b). It is observed
that on the Tokyo Bay A, needle-like ettringite crystals were
formed by the hydration process of the cement on the curing
period of 3 day (see 1a), which was characterized by a higher
level of strength. The photos also show how the needle-like
crystals spread throughout the entire specimen by the 182 day
(see 1b) and filled the void space. In the other hands, the
ettringite in Tokyo Bay B were observed on the 28 and 182 day
(see 2a, b), more void space was observed in the specimen’s
inner structure and the bonding of crystals did not seem very
prevalent. The evidence raises the possibility that the formation,
growth, and bonding of ettringite crystals play a major role in
the development of the strength and stiffness of SGM.
0 10 20 30 40 50 60 70
0
100
200
300
400
500
600
:
Tokyo Bay A (
w
L
=114.69%)
:
Tokyo Bay B (
w
L
=112.40%)
:
Okhotsk (
w
L
=85.61%)
:
Kobe (
w
L
=108.20%)
:
Kasaoka Clay (
w
L
=55.40%)
:
Kuni−bond (
w
L
=133.1%)
q
u
(KPa)
Frow value (cm)
Figure 2. Relationship between flow values of the SGM and
q
u
(curing period of 28 day)
0
100
200
300
400
0
0.2
0.4
0.6
0.8
1
q
u
(MPa)
G
vh
(MPa)
q
u
= 3.3
×
10
−3
G
vh
:
Tokyo Bay A (
w
L
=114.69%)
:
Tokyo Bay B (
w
L
=112.40%)
:
Kobe (
w
L
=108.20%)
:
Okhotsk (
w
L
=85.61%)
:
Kasaoka Clay (
w
L
=55.40%)
:
Kuni−bond (
w
L
=133.1%)
Figure 3. Relationship between
G
vh
and
q
u
0
100
200
300
400
0
100
200
300
400
G
hh
(MPa)
G
vh
(MPa)
1
1
:
Tokyo Bay A (
w
L
=114.69%)
:
Tokyo Bay B (
w
L
=112.40%)
:
Kobe (
w
L
=108.20%)
:
Kuni−bond (
w
L
=133.1%)
:
Kasaoka Clay (
w
L
=55.40%)
:
Okhotsk (
w
L
=85.61%)
Figure 4. Relationship between
G
vh
and
G
hh


