3228
Proceedings of the 18
th
International Conference on Soil Mechanics and Geotechnical Engineering, Paris 2013
To prepare SGM specimens, seawater taken from Hakodate
was used as the mixing water, blast furnace cement B as the
stabilizing agent, and air foam (with a density of 0.05g/cm
3
)
prepared with hydrolyzed animal protein using the pre-foaming
method as the foaming agent. These ingredients were then
mixed with each of the source soils that had been passed
through a sieve of 425
m and the resulting mixtures were put
into plastic molds with a 5cm diameter and a 10cm height. With
the top sealed by a plastic wrap, the mixtures were then cured in
the air until the prescribed curing ages were attained. Table 2
shows the flow values of the specimens after the water content,
w,
of the source soils used to prepare the SGM specimens for
this study was adjusted by sea water (hereafter “Adjusted Soil”)
and after the stabilizing agent and the air foam were mixed in.
The required wet density and the amount of stabilizing agent
added were respectively kept constant at
t
=1.1 g/cm
3
and 75
kg/m
3
, with the water content ratio of the Adjusted Soil at
285%, equivalent to 2.5
w
L
of Tokyo Bay A and B. While
Tokyo Bay A, B and Kobe had similar
w
L
values, the flow value
of Tokyo Bay B was slightly higher than those of the other two
after the stabilizing agent was added to the specimens. In
addition, the water content ratio of 285% was approximately
five times higher than the already low
w
L
of Kasaoka Clay,
causing its flow ability to rise. As a result, its flow value after
the stabilizing agent was added exceeded the size of the acrylic
plate (of 66 cm per side), which was used for the flow value
measurement.
The SGM was taken out of two cylinders per specimen on
each of the prescribed curing days to conduct the unconfined
compression test and the BE test. In the BE test, bender
elements were inserted in pairs at both vertical and horizontal
ends, and the shear wave velocity was measured in both vertical
and horizontal directions against the soil (
V
vh
,
V
hh
). From these
values and the wet density of the specimens,
t
, the elastic
shearing modulus (
G
vh
=
t
×
V
vh
2
,
G
hh
=
t
×
V
hh
2
) was obtained.
An internal observation of the SGM specimens was made using
an SEM on each of the prescribed curing days to examine the
correlation between the strength development and the
microscopic structure.
3 RESULTS AND DISCUSSIONS
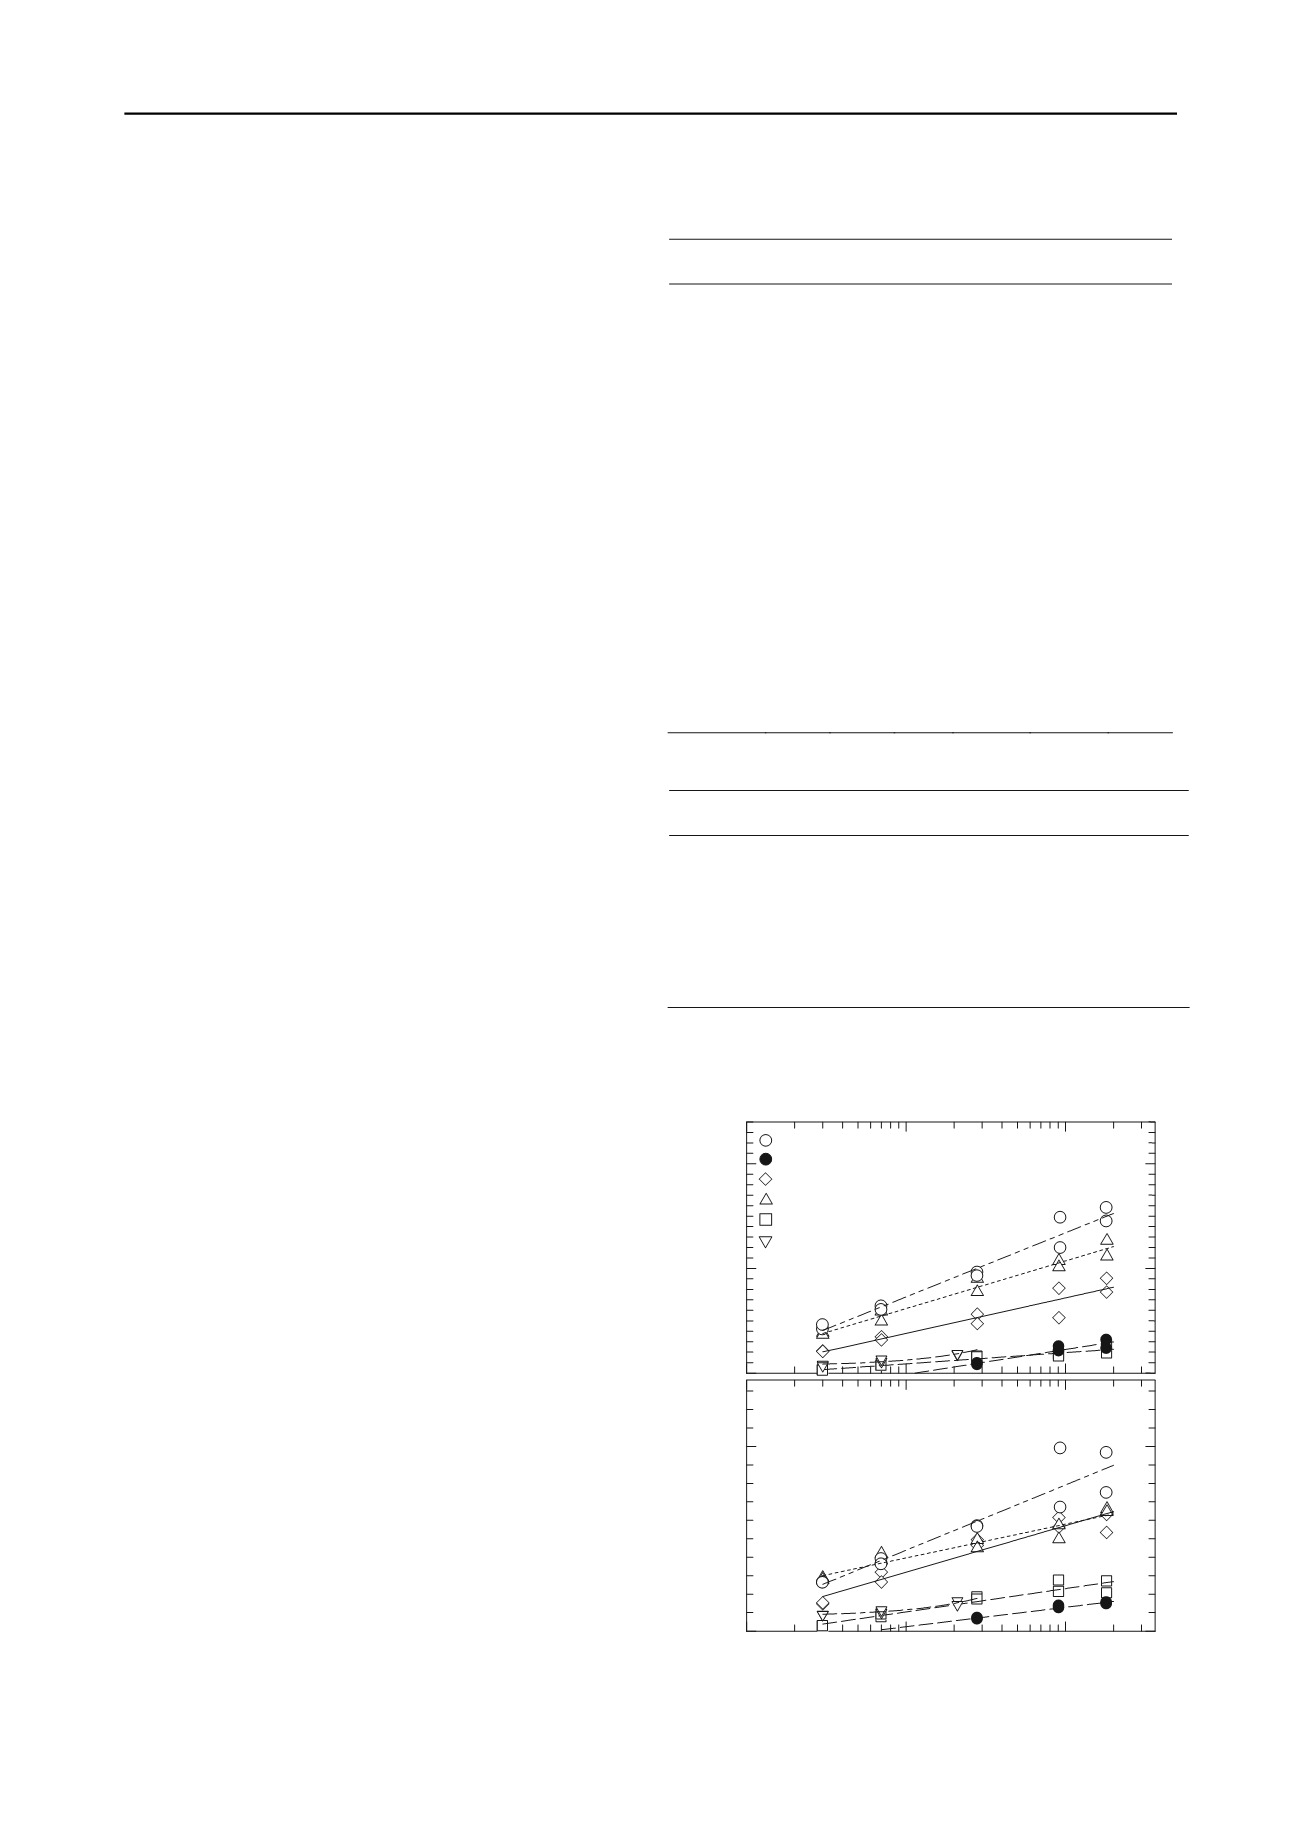
3.1
Strength and Shear modules of the SGM specimens
Figure 1 shows the changes to the
q
u
and
G
vh
levels of the
prepared specimens with the elapse of curing days. From the
results,
q
u
and
G
vh
of all specimens showed a linear increase in
the semi-log graph. However, a substantial degree of variability
was observed from one source soil to another in the soil strength
measured on the same curing day even though the mixing
conditions, such as the cement quantity per unit volume and the
w
of the Adjusted Soil were identical. In particular, among the
three types of dredged soil (Tokyo Bay A , Tokyo Bay B and
Kobe) that shared almost identical physical properties such as
w
L
, the
q
u
level of Tokyo Bay B was much lower than the other
two. It is suspected that the composition of the pore water was
suppressing the strength development of Tokyo Bay B, given
that its pH level was lower than those of the other two
specimens. On the other hands, the
w
L
levels of Okhotsk and
Kasaoka Clay were lower than those of the aforementioned
three types of dredged soil. While Okhotsk showed large
q
u
and
G
vh
values, comparable to those of Tokyo Bay A, Kasaoka Clay
had very low
q
u
and
G
vh
values, similar to those of Tokyo Bay
B. The factors causing the large
q
u
and
G
vh
values of Okhotsk
are suspected to be the large volume of silt in the soil. The small
q
u
and
G
vh
values of Kasaoka Clay are believed to be caused by
the material separation that occurred after the cement and air
foam were mixed in because of the high
w
ratio of the Adjusted
Soil of 285 %, about 5 times greater than its
w
L
. The decrease in
the strength of Kasaoka Clay is also likely to have resulted from
its clay mineral components since the pore water composition
Table 1. Sample preparation
samples
Tokyo
Bay A
Tokyo
Bay B
Kobe Okhotsk
Kasaoka
Clay
Kuni-
bond
s
(g/cm
3
)
2.62
2.70
2.64
2.56
2.71
2.70
w
L
(%)
114.7
112.4 108.2
85.6
55.4
133.1
L
i
(%)
10.4
11.5
9.7
7.2
8.2
7.8
pH
7.7
3.4
7.9
7.6
7.5
-
Grain size
distribution
(%)
Sand
2
8
0
6
7
6
Silt
27
21
31
47
33
65
Clay
(2~5
m)
38
32
33
23
16
16
Clay
(~2
m)
33
39
36
24
44
12
clay
mineral
Qtz
Pl
Ill
Chl
Sme
Qtz
Pl
Gp
Ill
Chl
Kln
Qtz
Pl
Ill
Chl
Sme
Qtz
Pl
Ill
Chl
Sme
Qtz
Pl
Ill
Sme
Kln
Qtz
Pl
Sme
Table 2. Water contents and flow values of the SGM specimens
samples
Tokyo
Bay A
Tokyo
Bay B
Kobe
Okhotsk
Kasaoka
Clay
Kuni-
bond
285
285
285
285
285
285
w
(%)
(2.5
w
L
) (2.5
w
L
) (2.6
w
L
) (3.3
w
L
)
(5.1
w
L
)
(2.1
w
L
)
Frow value
(cm)
Adjusted
soil
47.5
58.0
49.0
64.0
66.0 ~
57.0
SGM
19.0
27.5
21.0
36.0
66.0 ~
39.0
: 66.0 ~ shows 66.0 over
0
200
400
600
800
1000
1200
1 2
10 20
100 200
0
100
200
300
q
u
(KPa)
Curing period (day)
:
Tokyo Bay A (
w
L
=114.69%)
:
Tokyo Bay B (
w
L
=112.40%)
:
Okhotsk (
w
L
=85.61%)
:
Kobe (
w
L
=108.20%)
:
Kasaoka Clay (
w
L
=55.40%)
G
vh
(MPa)
:
Kuni−bond (
w
L
=133.1%)
Figure 1. Variation of
q
u
and
G
vh
with the curing periods


