 
          3241
        
        
          Technical Committee 307 /


            Comité technique 307


          0 5 10 15 20 25
        
        
          0
        
        
          200
        
        
          400
        
        
          600
        
        
          0
        
        
          200 400 600
        
        
          0
        
        
          200
        
        
          400
        
        
          600
        
        
          Axial strain


            a


          (%)
        
        
          Deviator stress


            q


          (kPa)
        
        
          Mean effective stress


            p


          (kPa)
        
        
          Deviator stress


            q


          (kPa)


            q


          =M


            p


          (a) C=30kg/m
        
        
          3
        
        
          0 5 10 15 20 25
        
        
          0
        
        
          200
        
        
          400
        
        
          600
        
        
          0
        
        
          200 400 600
        
        
          0
        
        
          200
        
        
          400
        
        
          600
        
        
          Axial strain


            a


          (%)
        
        
          Deviator stress


            q


          (kPa)
        
        
          Mean effective stress


            p


          (kPa)
        
        
          Deviator stress


            q


          (kPa)


            q


          =M


            p


          (b) C=70kg/m
        
        
          3
        
        
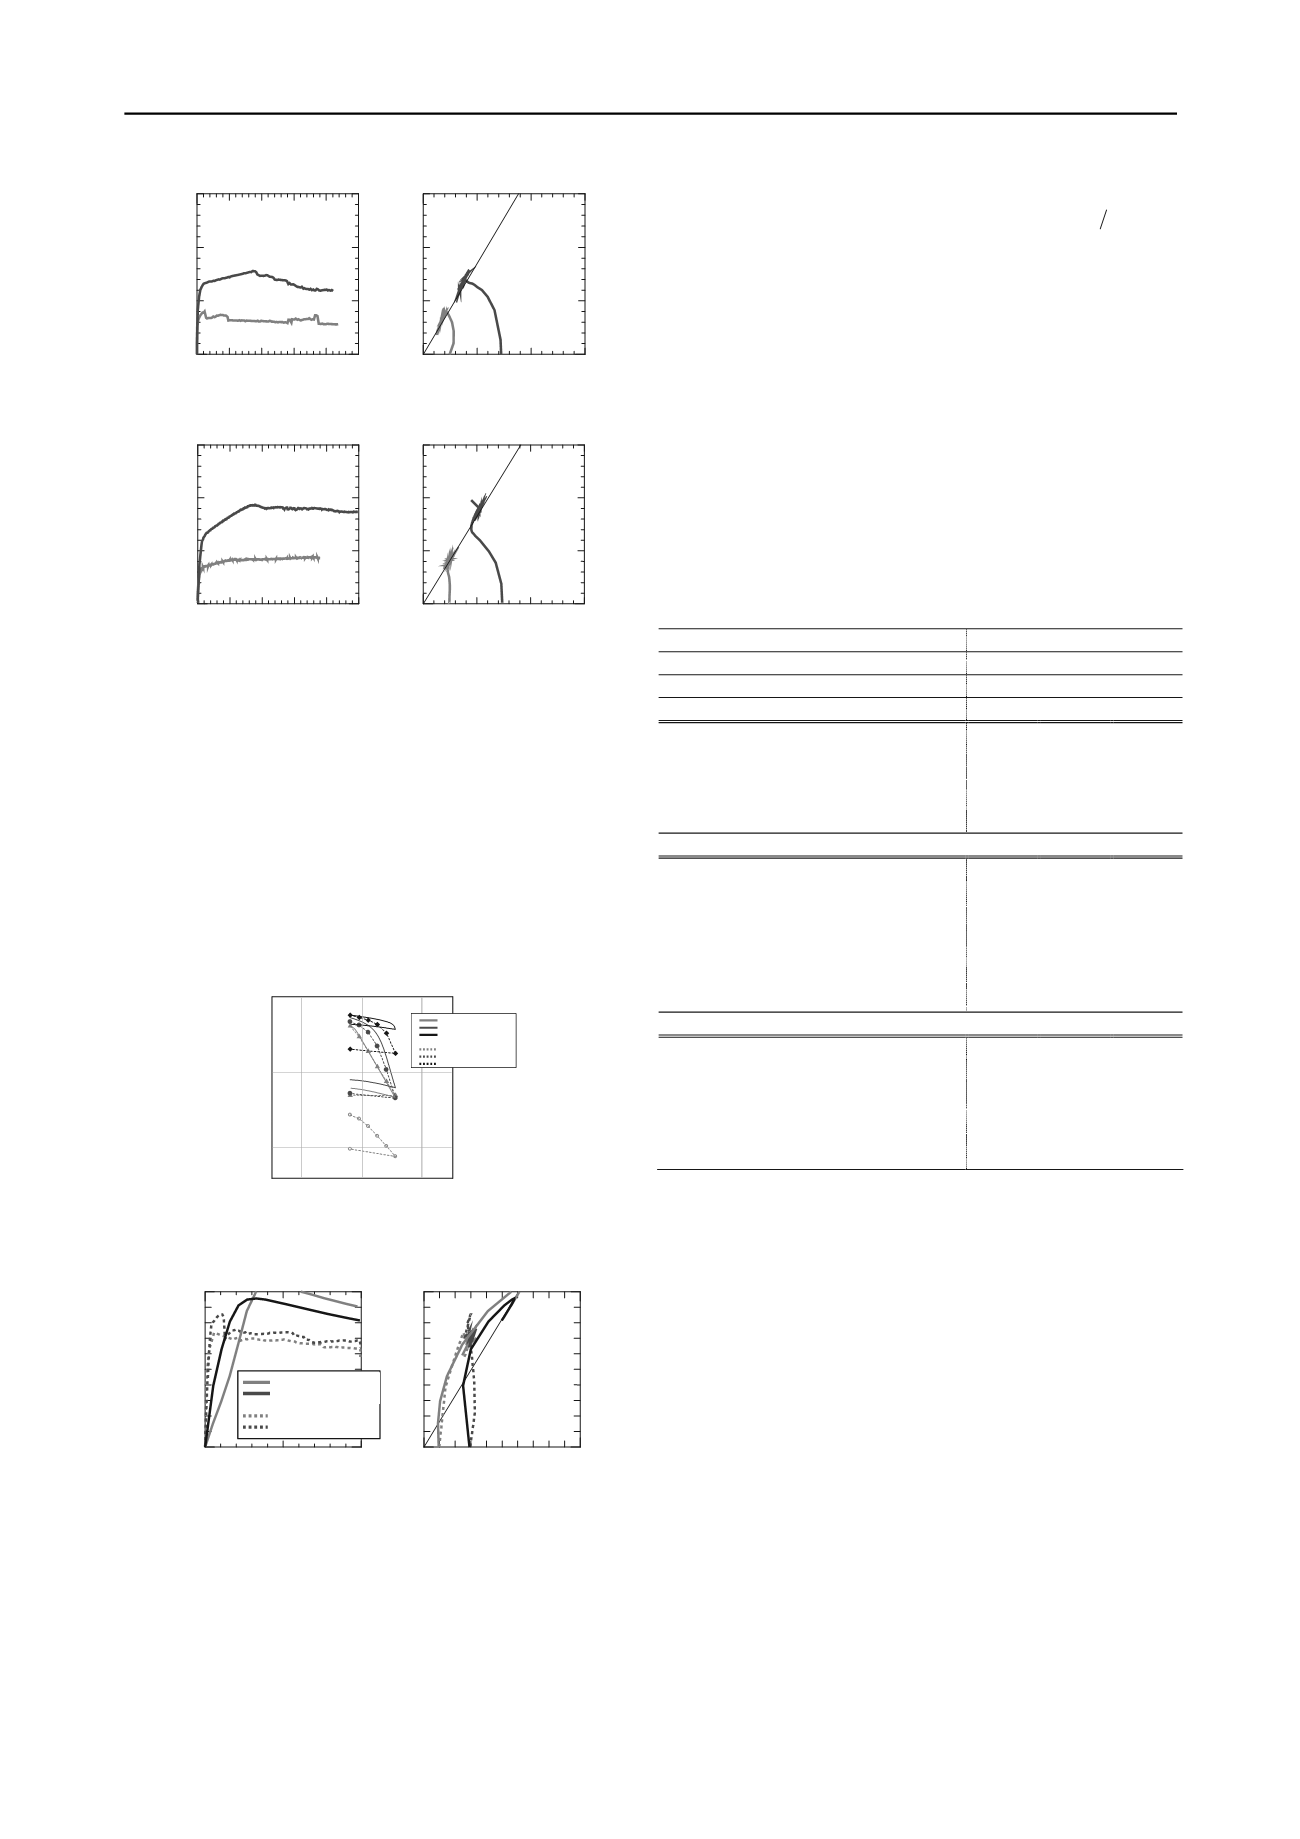
          Figure 6. Consolidated undrained triaxial compression test results for
        
        
          remolded treated soils
        
        
          Fig. 7 shows the oedometer test results for treated soil and
        
        
          the results reproduced using the SYS Cam-clay model. The test
        
        
          results show that as the cement content is increased, the
        
        
          consolidation yield stress increases, and in all cases, when the
        
        
          consolidation yield stress is exceeded, high compressibility is
        
        
          exhibited. For all the cement contents, it is considered that a
        
        
          high structure has been produced by the addition of cement. The
        
        
          analysis was generally capable of reproducing these trends.
        
        
          However, as the cement content increased, the accuracy was
        
        
          reduced.
        
        
          10
        
        
          –1
        
        
          10
        
        
          0
        
        
          10
        
        
          1
        
        
          10
        
        
          2
        
        
          10
        
        
          3
        
        
          10
        
        
          4
        
        
          10
        
        
          5
        
        
          1.6
        
        
          1.8
        
        
          2
        
        
          2.2
        
        
          2.4
        
        
          2.6
        
        
          2.8
        
        
          3
        
        
          3.2
        
        
          3.4
        
        
          3.6
        
        
          3.8
        
        
          4
        
        
          Verticalstress
        
        
          σ
        
        
          v
        
        
          (kPa)
        
        
          Specific volume


            v


          計算結果
        
        
          実験結果
        
        
          Calculation
        
        
          Test
        
        
          Specific volume


            v


          10 10 10 10
        
        
          Vertic tress
        
        
          σ
        
        
          v
        
        
          (kPa)
        
        
          Figure 7. Treated soil standard consolidation test results and their
        
        
          analytical reproduction
        
        
          0
        
        
          10
        
        
          20
        
        
          200
        
        
          400
        
        
          600
        
        
          800
        
        
          1000
        
        
          0 200 400 600 800 1000
        
        
          200
        
        
          400
        
        
          600
        
        
          800
        
        
          1000
        
        
          Shear strain


            s


          (%)
        
        
          Deviator stress


            q


          (kPa)
        
        
          Mean effective stress


            p


          (kPa)
        
        
          Deviator stress


            q


          (kPa)


            q =


          M


            p


          計算結果
        
        
          実験結果
        
        
          Calculation
        
        
          Test
        
        
          (c) C=70kg/m
        
        
          3
        
        
          Fig. 8 Consolidated undrained triaxial test results for treated soil and
        
        
          their analytical reproduction
        
        
          Fig. 8 shows the undrained shear test results and the
        
        
          reproduced results for treated soil. The critical state line CSL
        
        
          for remolded treated soil is also shown in this figure.
        
        
          From the test results, the softening behavior occurs below
        
        
          for treated soil with


            C


          =30 kg/m
        
        
          3
        
        
          . For treated soil with


            C


          =50 kg/m
        
        
          3
        
        
          , softening behavior occurs above


            p q


          M


            p q


          M


            p q


          M
        
        
          under
        
        
          high confining pressure. For treated soil with


            C


          =70 kg/m
        
        
          3
        
        
          , there
        
        
          and a high overconsolidation ratio. As the cement content is
        
        
          increased, the maximum value of the stress ratio
        
        
          is distinct hardening behavior associated with plastic expansion


            pq


          easily
        
        
          exceeds M, and for


            C


          =70 kg/m
        
        
          3
        
        
          , the effective stress
        
        
          hes the
        
        
          tension cut-off line (


            p q


          reac


          3
        
        
          ). The analysis reproduced the
        
        
          behavior of the treated
        
        
          low cement content, but it was
        
        
          difficult to reproduce the behavior above


            p q


          soil for


          M
        
        
          for treated
        
        
          soil with a high cement content.
        
        
          Table 3 shows the initial values
        
        
          constants of
        
        
          the
        
        
          Table 3 SYS Cam-clay m
        
        
          al
        
        
          of the material
        
        
          constants and initial values
        
        
          SYS Cam-clay model used in the analysis. The addition of
        
        
          cement produced high structure and pseudo overconsolidation.
        
        
          Also, the overconsolidation ratio increased as the cement
        
        
          content increased, but on the other hand, the extent of evolution
        
        
          of structure reduced. This is considered to be due to the fact that
        
        
          the water content of the dredged soil was constant in the
        
        
          mixture conditions used, so as the cement content increased, the
        
        
          water-cement ratio reduced, and this corresponds to the increase
        
        
          of N of the remolded treated soil as the cement content
        
        
          increased.
        
        
          odel materi
        
        
          lasticity parameters
        
        
          Treated soil
        
        
          P
        
        
          Cement content
        
        
          (kg/m
        
        
          3
        
        
          C=30
        
        
          C=70
        
        
          )
        
        
          C=50
        
        
          Water-cement ratio
        
        
          25.2
        
        
          15.0
        
        
          10.6
        
        
          Confining pressure (kPa)
        
        
          98.1
        
        
          98.1
        
        
          98.1
        
        
          Compression index
        
        
          λ
        
        
          0.21
        
        
          0.36
        
        
          0.51
        
        
          Swelling index
        
        
          κ
        
        
          0.05
        
        
          0.05
        
        
          0.03
        
        
          Limit state const
        
        
          M
        
        
          ant
        
        
          1.70
        
        
          1.60
        
        
          1.65
        
        
          NCL intercept
        
        
          N
        
        
          2.70
        
        
          3.40
        
        
          4.20
        
        
          Poisson’s ratio
        
        
          ν
        
        
          0.30
        
        
          0.30
        
        
          0.30
        
        
          Evolution rule parameters
        
        
          Normal consolidated soil index
        
        
          m
        
        
          0.01
        
        
          0.60
        
        
          5.00
        
        
          Structure degradation index
        
        
          a
        
        
          0.25
        
        
          0.60
        
        
          1.50
        
        
          b
        
        
          1.00
        
        
          1.00
        
        
          1.00
        
        
          c
        
        
          1.00
        
        
          1.00
        
        
          1.00
        
        
          Plastic shear:plastic compression c
        
        
          s
        
        
          0.20
        
        
          0.50
        
        
          0.10
        
        
          Rotation hardening index
        
        
          b
        
        
          r
        
        
          0.00
        
        
          0.00
        
        
          0.00
        
        
          Rotation hardening limit in
        
        
          b
        
        
          dex
        
        
          m 0.50
        
        
          0.50
        
        
          0.50
        
        
          Initial values
        
        
          Overconsolidation ratio
        
        
          0
        
        
          1.03
        
        
          20.9
        
        
          63.8
        
        
          1


            /R


          Extent of structure
        
        
          0
        
        
          �
        
        
          1


            /R


          260
        
        
          10.00
        
        
          5.00
        
        
          Vertical stress
        
        
          σ
        
        
          v
        
        
          19.6
        
        
          19.6
        
        
          19.6
        
        
          Specific volume
        
        
          v
        
        
          0
        
        
          3.94
        
        
          3.75
        
        
          3.80
        
        
          Stress ratio
        
        
          η
        
        
          0
        
        
          0.00
        
        
          0.00
        
        
          0.00
        
        
          Initial anisot
        
        
          ζ
        
        
          0
        
        
          ropy
        
        
          0.00
        
        
          0.00
        
        
          0.00
        
        
          3 SOIL-WATER COUPLED FINITE DEFORMATION
        
        
          mechanical behavior
        
        
          3.1


            Analysis


            soil-water coupled finite


          e deformation analysis code
        
        
          ANALYSIS FOR TRIAXIAL TESTS
        
        
          In the above, we attempted to explain the
        
        
          of treated soil from the point of view of considering the triaxial
        
        
          test as an element test. However, from observation of the failure
        
        
          mode of the test specimens, The characteristic brittle failure had
        
        
          occurred in the treated soil. Therefore, in this section, the effect
        
        
          of nonuniform deformation on the triaxial test results was
        
        
          investigated, taking the triaxial test to be a boundary problem.


            conditions for the


          init


            deformation analysis


          The soil-water coupled f


              GEOASIA


          (Noda et al. 2008), which incorporates the SYS
        
        
          Cam-clay model as the constitutive equation for soil structure,
        
        
          was used in the analysis. The analysis was carried out under
        
        
          plane strain conditions, and Fig. 9 shows the finite element
        
        
          mesh and boundary conditions. An undrained boundary was set
        
        
          around the test specimen, and frictional conditions were
        
        
          assumed at the top and bottom end surfaces with a rigid cap and
        
        
          pedestal. A primary asymmetric mode with a cosine curve (half
        
        
          period) having an amplitude of 0.005 cm (Asaoka et al. 1995)