3242
Proceedings of the 18
th
International Conference on Soil Mechanics and Geotechnical Engineering, Paris 2013
was applied as an initial geometric imperfection to the side
surfaces of the test specimen. The shear velocity was 1.4
×
10
-
2
%/min, with a downward displacement velocity applied to the
top end surface of the test specimen. The target test was
C
=50
kg/m
3
under confining pressure 294 kPa as shown in Fig. 3. The
triaxial test was considered to be an a boundary problem, and
the calculation was carried out using the material constants and
initial values for the SYS Cam-clay model (Table 3).
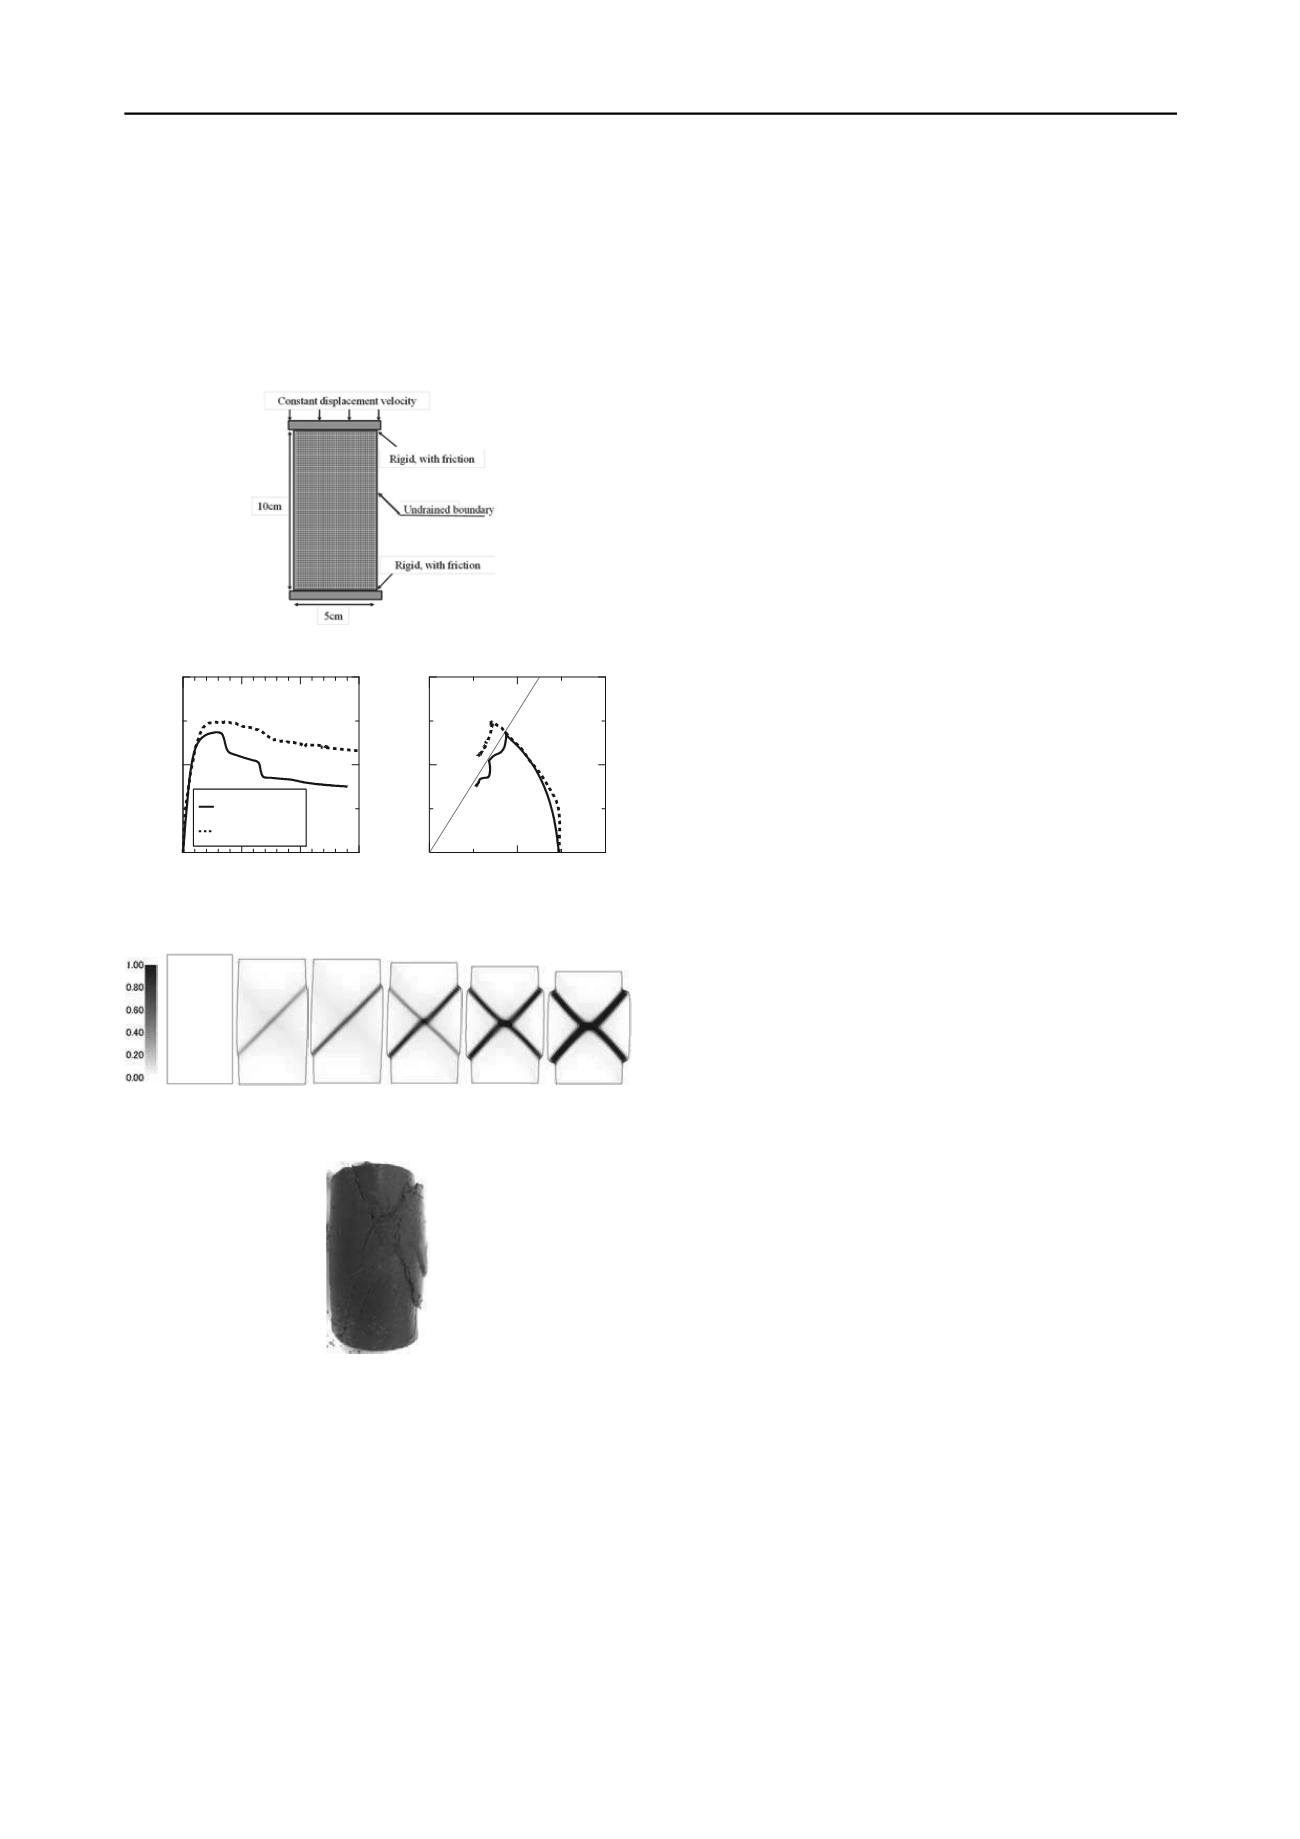
Figure 9. Finite element mesh and boundary conditions
0
5
10
15
200
400
0
200
400
200
400
Axial strain
a
(%)
Deviator stress
q
(kPa)
Mean effective stress
p
(kPa)
Deviator stress
q
(kPa)
q =
M
p
Calculation
Test
Figure 10. Consolidated undrained triaxial test results for remolded
treated soil
0%
4%
5%
7%
10%
14%
F
1. Consolidated undrained triaxial analysis results for remolded
igure 1
treated soil
e of the test speci
Photograph 1 Failure shap
en
3.2
Soil-water coupled finite deformation analysis results
4 CONCLUSIONS
xplain the mechanical behavior and
r of cement-stabilized treated soil:
In
soil: In the
oe
-clay model: The
ad
Although
the
5 REFERENCES
e model for the
Lee
Asa
Coa
Nod
m
Fig. 10 shows the analysis results arranged considering the test
specimen to be one element, together with the test results. Fig.
11 shows the shear strain distribution from the analysis. From
the axial deviator stress-axial strain relationship in Fig. 10, it
can be seen that at around 3% of axial strain and at around more
than 6% of axial strain, the deviator stress suddenly drops. In
the shear strain distribution in Fig. 11, ‘diagonal shear band’
occurs at about the same axial strain as in Fig. 10, then a shear
band in the opposite direction occurs, and finally X-shaped
shear bands are formed. The occurrence of shear bands and the
drop in
q
coincide, so it can be seen that the cause of the drop in
q
is the occurrence of shear bands. In the test results, a clear
load drop occurs at around 7–8% axial strain, but at around 5%,
a small load drop can also be seen. Photograph 1 shows a view
of the test specimen after shearing. X-shaped shear bands are
formed as in the analysis.
We attempted to e
improvement effect of treated soil due to the addition of cement
based on test results, the SYS Cam-clay model, which is an
elasto-plastic constitutive model that incorporates the concept of
soil skeleton structure, and
GEOASIA
. The following
conclusions were obtained.
(1) Mechanical behavio
the oedometer tests, as the cement content increased, the
initial specific volume increased, the consolidation yield stress
increased, and the compressibility was smaller up to the
consolidation yield stress. In the triaxial tests, as the cement
content increased, the maximum value of the stress ratio
q/p'
increased and approached the tension cut-off line.
(2) Mechanical behavior of remolded treated
dometer tests, as the cement content increased, the intercept
N and the slope
of the NCL increased. In the triaxial tests, the
M did not vary much with cement content.
(3) Reproduction using the SYS Cam
dition of cement produces a higher structure and pseudo
overconsolidation in the soil. Also, differences in cement
content are easily reflected in differences in the
overconsolidation ratio, and differences in water-cement ratio
are easily reflected in the degree of structure. The analysis
reproduced the mechanical behavior of treated soil, but for high
cement contents, reproduction by analysis was difficult, which
suggests that it is necessary to introduce a new model.
(4) Finite element analysis of the triaxial test:
re were differences in the axial strain at occurrence of shear
banding and the amount of drop in
q
, the analysis was capable
of reproducing the trends of both occurrence of shear banding
and the sudden drop in
q
. However, material constants and
initial values used in the analysis were obtained by considering
the triaxial test to be an element test. It is necessary to
incorporate the viewpoints of both element tests and boundary
problems in order to comprehend the natural behavior of the
treated soil.
Hirai, H. et al. 1989. An elastic-plastic constitutiv
behavior of improved sandy soils. S&F 29 (2), 69-84.
Yu, Y. et al. 1998. A damage model for soil-cement mixture. S&F 38
(3), 1-12.
Kasama, K. et al. 2000. On the stress-strain behavior of lightly
cemented clay based on an extended critical state concept. S&F 40
(5), 37-47.
, K. et al. 2004. Constitutive model for cement treated clay in a
critical state frame work. S&F 44 (3), 69-77.
Wada, M. et al. 2004. FEM Analysis of Stabilized Processed Soil Using
a Superloading Yield Surface. Japan Society of Civil Engineers
59th Annual Conference, 1013-1014.
oka et al. 2002. An elasto-plasticelasto-plastic description of two
distinct volume change mechanisms of soils. S&F 42 (5), 47-57.
Asaoka et al. 1995. Imperfection-sensitive bifurcation of Cam-clay
under plane strain compression with undrained boundaries. S&F 35
(1) 83-100.
stal Development Institute of Technology 2008. Technical Manual
for the In-tube Mixed Stabilization Process Method (Revised
Version).
a et al. 2008. Soil-water coupled finite deformation analysis based
on a rate-type equation of motion incorporating the SYS Cam-clay
model. S&F 48 (6), 771-790.


