3404
Proceedings of the 18
th
International Conference on Soil Mechanics and Geotechnical Engineering, Paris 2013
0 0.4 0.8 1.2 1.6 2
Time (days)
0
20
40
60
80
100
Temperature (ºC)
(a)
T
1
heater
T
2
bottom 25mm
T
3
top 75mm
T
4
water bath
(b)
0 0.4 0.8 1.2 1.6 2
Time (days)
0
0.4
0.8
1.2
1.6
2
Pore water pressure (MPa)
Pw
1
bottom 25 mm
Pw
2
top 75 mm
upper valve closed
backpressure 1MPa
P = 9.58 W
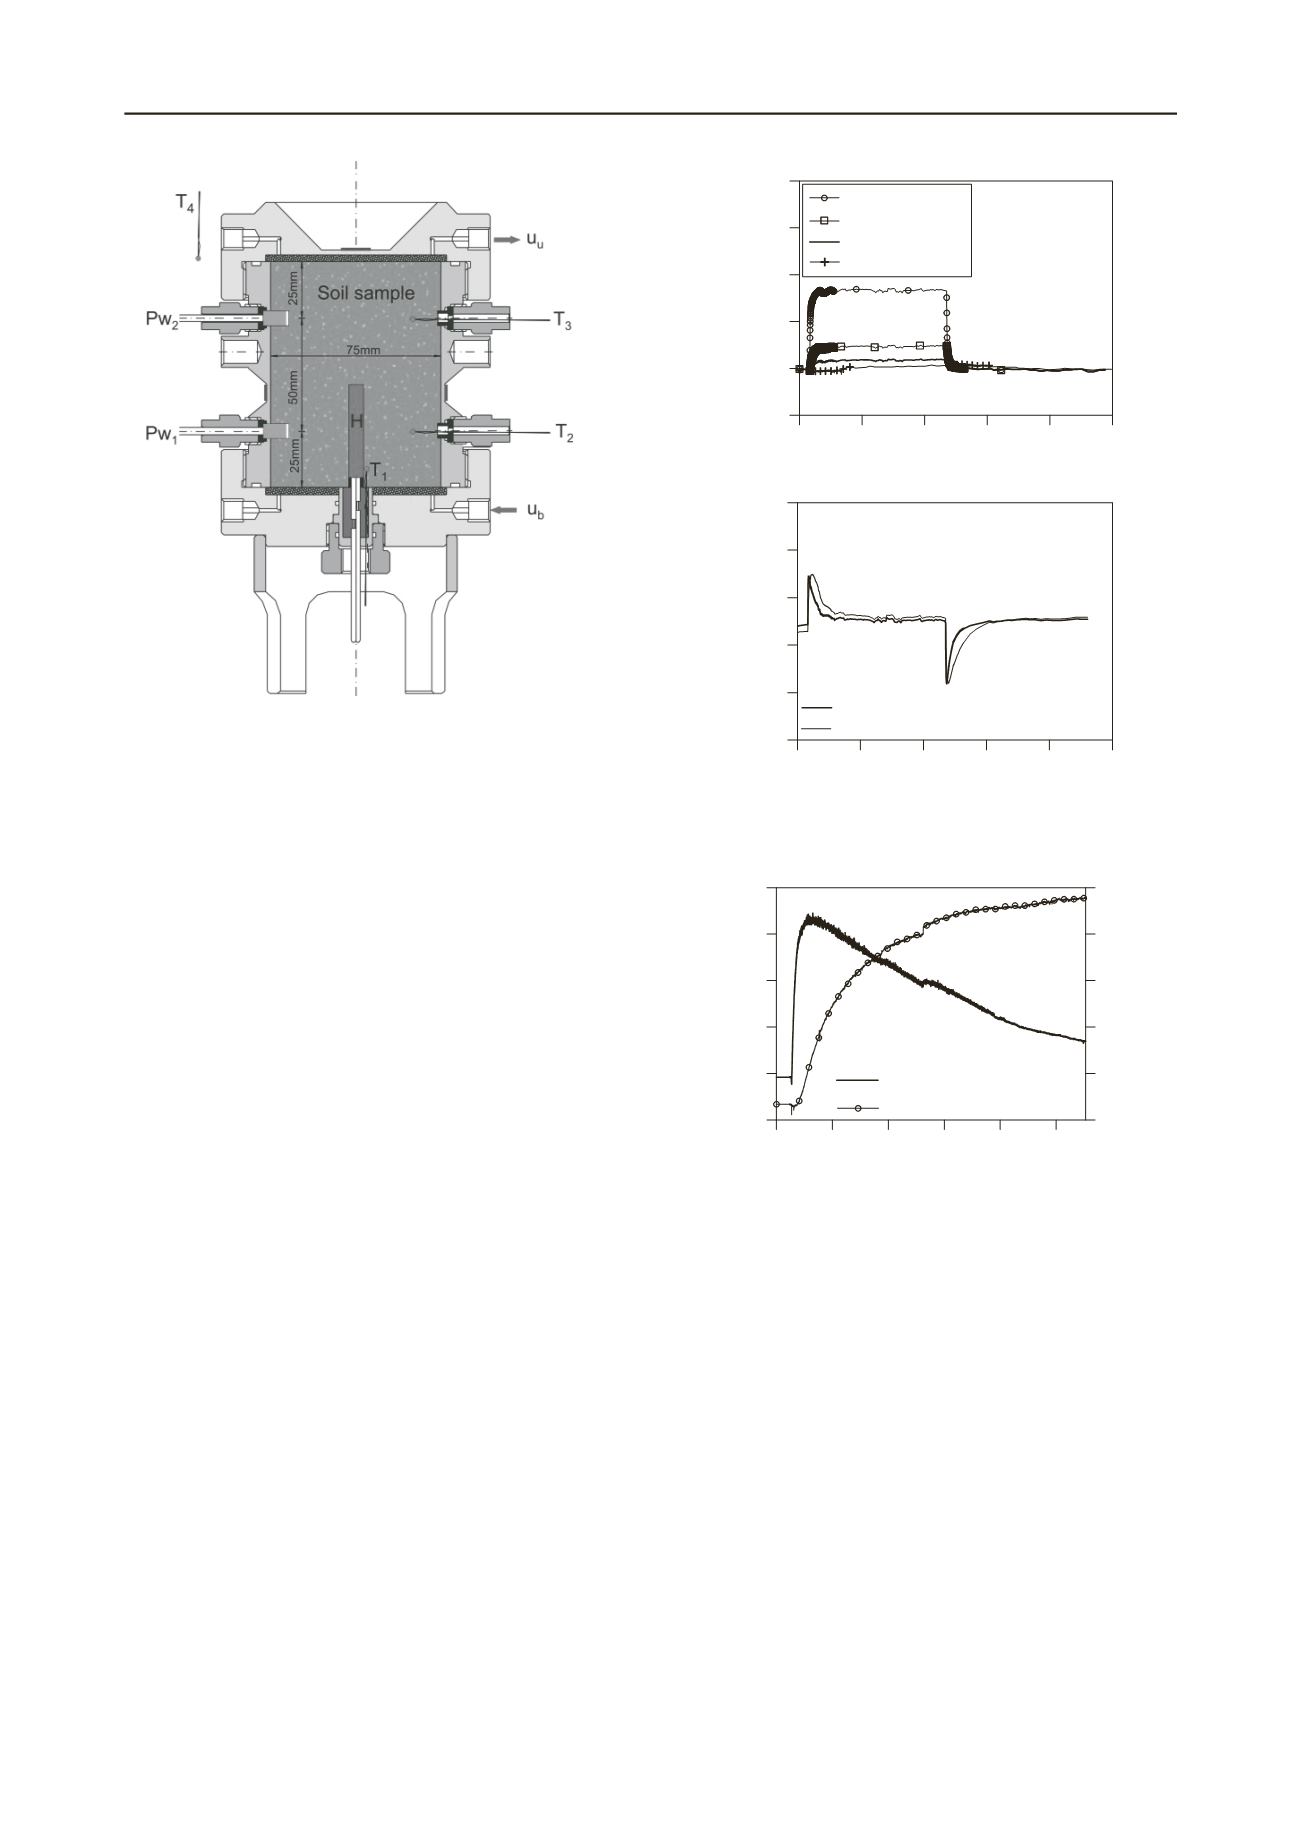
Figure 1. Axi-symmetric heating cell and transducers (Muñoz
et al
.
2009, Lima
et al
. 2010, Lima 2011).
3 EXPERIMENTAL RESULTS
Attention has been focused on the time evolution of temperature
and pore water pressure changes during heating and cooling
paths –i.e., pore pressure build-up during quasi-undrained
heating and later dissipation to the applied hydraulic boundary
conditions–. Throughout the course of the heating/cooling
paths, the bottom drainage is maintained open at constant water
backpressure (1 MPa) using an automatic pressure / volume
controller, while the upper valve is kept closed. This
backpressure is important since it allows measuring the pore
pressure drop during the cooling phase without reaching the
negative range (below atmospheric conditions). The initial and
external temperatures are regulated by submerging the cell
inside a temperature controlled water bath at temperature
T
4
(Figure 1). Figure 2a shows the time evolution of temperature
for different locations and along a heating and cooling cycle up
to a maximum heater temperature of 54ºC. Figure 2b presents
the corresponding time evolution of pore water pressures at
different locations. During heating, pore water pressure
increased due to the larger thermal expansion coefficient of
water. The magnitude of the water pressure change depends on
the rate of temperature increase / decrease, on soil
compressibility and thermal-expansion coefficient, on water
permeability and porosity, as well as on the hydraulic boundary
condition applied. After the heating path, pore water pressure
dissipates at constant temperature towards the hydraulic value
applied at the boundary. Pore water pressure
Pw
2
dissipates
more slowly due to the larger distance to the draining boundary.
An opposite pore pressure evolution is observed on cooling: an
initial pore pressure drop followed by pressure recovery to the
applied boundary condition (again,
Pw
recovers more slowly).
2
Figure 3 shows a zoom of the early stage evolution of pore
water pressure
P
w1
and temperature
T
2
changes during another
heating phase. These sensors are located close to the draining
boundary (Figure 1). It can be observed that pressure changes
develop at a faster rate compared to temperature changes. In
fact, pore pressure starts to dissipate towards the applied
hydraulic boundary condition well before the temperature
reaches its maximum value.
Figure 2. Temperature and pore water pressure evolutions during
heating and cooling paths (Lima
et al
. 2010, Lima 2011).
Figure 3. Zoom of time evolution of temperature and pore
ate
Lima 2011).
w r pressure during heating (Lima
et al
. 2010,
4 INTERPRETATION OF RESULTS
In the interpretation of the test results, it was assumed that
temperatures and heat flux were not influenced by water
pressure and flow, which means that heat convection was
assumed to be negligible. The driving process for temperature
change during the test is thus conduction only. This assumption
is justified by the condition of constant overall volume
prevailing in the heating cell that makes the change in porosity
and the velocities of the solid phase very small. Moreover, the
low permeability of the material prevents the existence of high
velocities for the liquid phase. The flux of heat convected by the
solid and liquid phases is, therefore, extremely low. In contrast,
water pressure and flow were assumed to be influenced by
temperature: as a consequence, while the thermal problem was
decoupled from the hydraulic one, the hydraulic problem was
coupled to the thermal one.
The test was then interpreted in two separated stages. First, a
back-analysis of temperature measurements was carried out by
performing uncoupled thermal simulations using the finite
element program CODE_BRIGHT (Olivella
et al
. 1996); only
the balance equation for energy was solved. Heat exchanged by
95 114 133 152 171 190
Time (min)
0.8
1
1.2
1.4
1.6
1.8
Pore water pressure (MPa)
18
22
26
30
34
38
Temperature (ºC)
heating phase
Pw
1
bottom 25 mm
T
2
bottom 25mm


