3412
Proceedings of the 18
th
International Conference on Soil Mechanics and Geotechnical Engineering, Paris 2013
nominal strain (
), the void ratio (
e
) and the nominal strain rate
(
T
)werecalculated using the displacement.
As shown in Fig. 2 a metal pipe was spiralled around the
specimenand an isothermal liquid was circulated through this
pipe to control the temperature(
T
), which was measured by a
thermocouple attached to the upper side of the consolidation
cell.To avoid the offset drift of measuring instruments due to
changes in the temperature, the whole CRS testing apparatus
was preliminarily kept under a testing temperature by
circulating isothermal liquid.Then, the measuring instruments
were initialized and the CRS test was started.
Reconstituted samples were used, to avoid the variability in
soil properties for tested samples and to identify only the
temperature effect. The samples were made from Louiseville
clay, which was obtained from the Louiseville site along the St.
Lawrence River in Quebec, Canada. Their main geotechnical
properties are as follows: the liquid limit,the plastic limit and
the density of soil particles are 71%, 22% and 2.767g/cm
3
,
respectively. Its detailed properties were referred by Tanaka et
al. (2001).
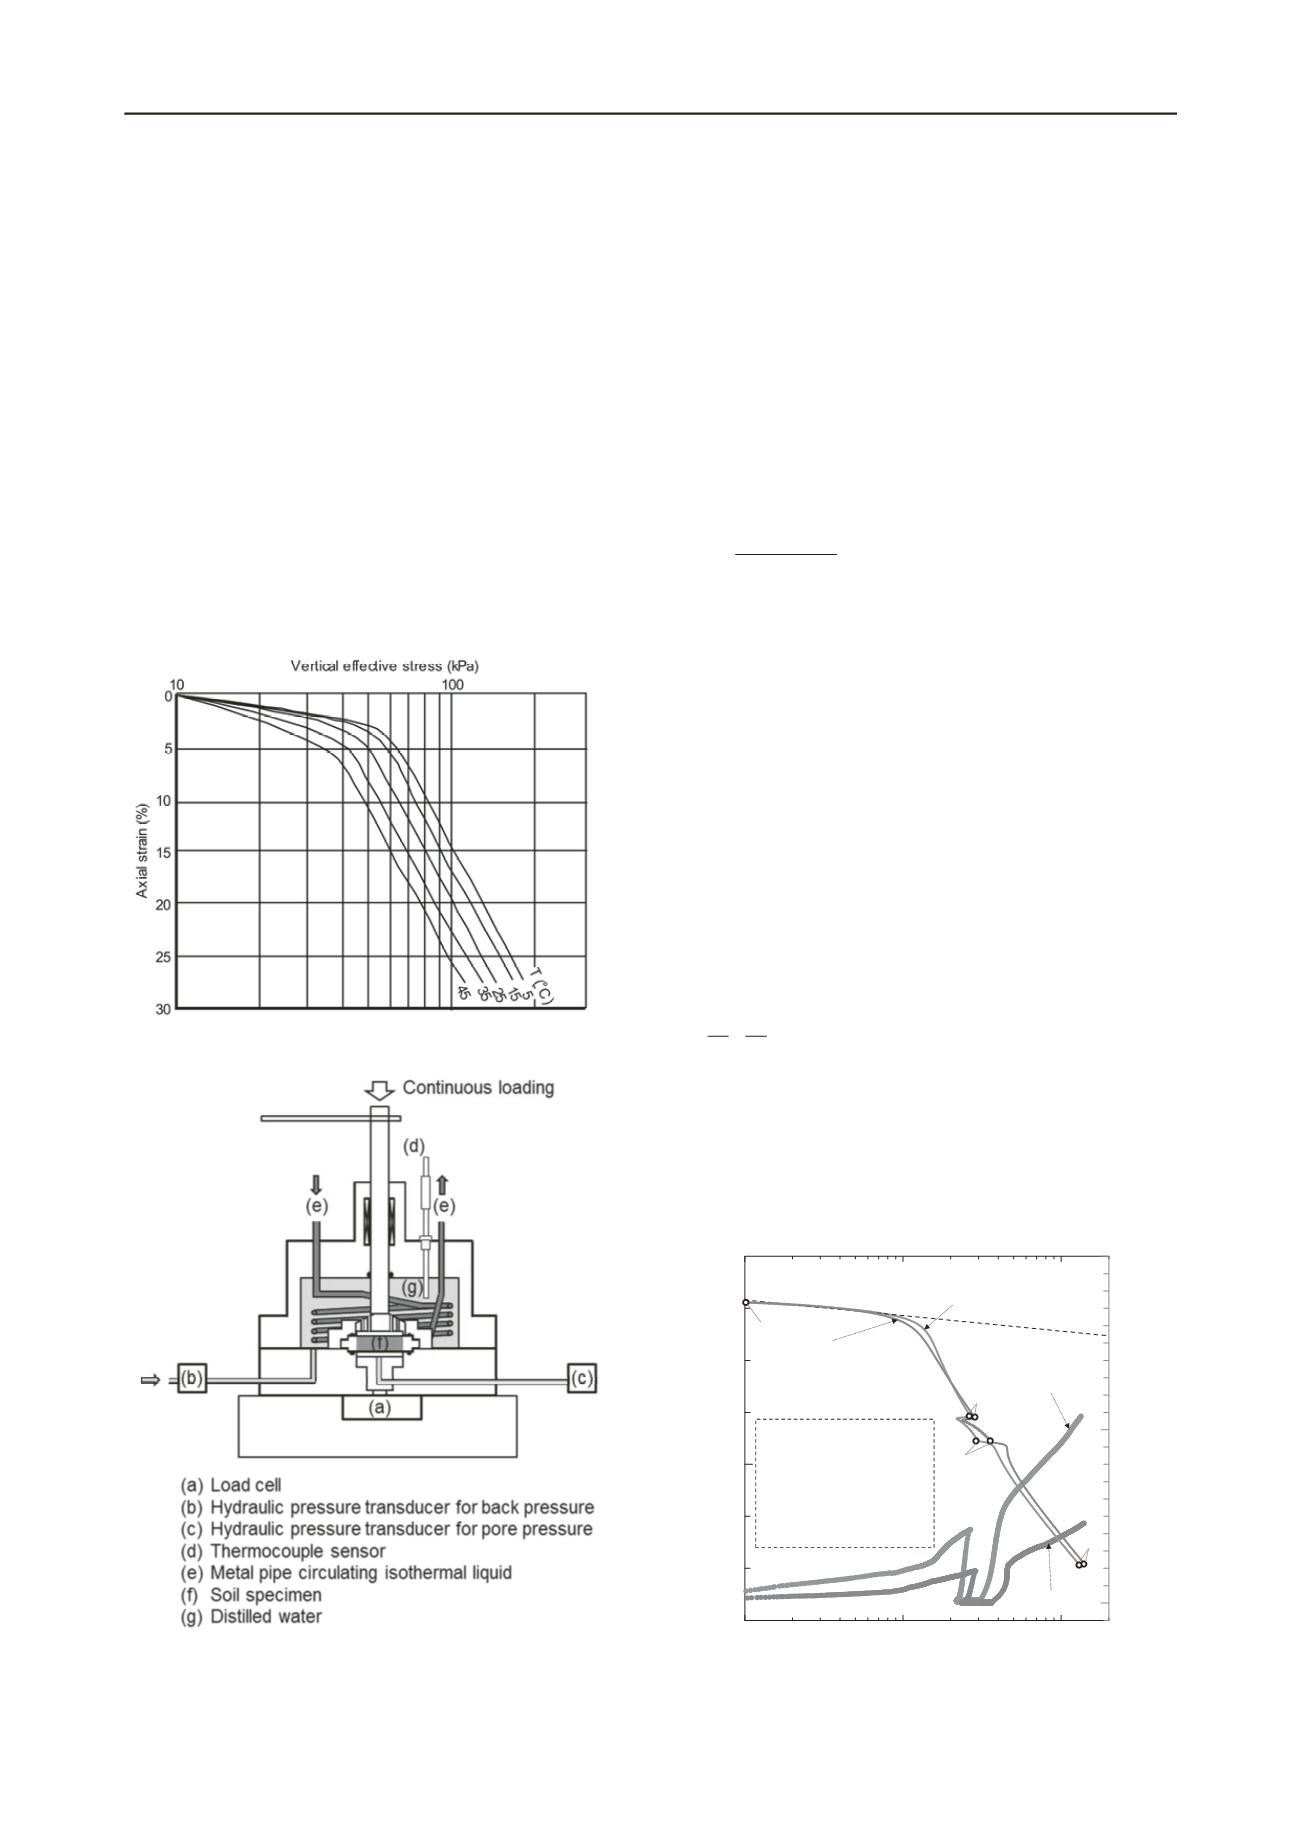
Figure1. A typical example of temperature effect on compression curves
(after Eriksson, 1989).
Figure 2. A schematic view of CRS testing apparatus for controlling
temperature.
3 TEST RESULTS AND DISCUSSIONS
3.1
Temperature effects on permeability
Figure 3 shows therelationshipbetween
e
-log
p’
and
u
-log
p’
obtained from the CRS tests for Louiseville reconstituted
samples. The testing was performed at a constant
T
value of 10
℃
or 50
℃
, while the strain rate was changed during a test. The
e
-log
p’
curve segments between Points a and b as well as d and
f were obtained under the reference strain rate of 3×10
-6
s
-1
(
T
)
and that between Points b and d under
T
/100. In Fig.3,
u
generated at 50
℃
is clearly smaller than that at 10
℃
. It is
considered that such a difference in
u
is caused by different
hydraulic conductivity (
k
). According to JIS A 1227 (2009),
k
may be calculated by Eq. (2):
T
wT n
0 t
2
g H H
k
u
(2)
where,
w
,
g
n
,
H
0
and
H
t
are the unit weigh of water, the
acceleration of gravity, specimen heights at initial and at each
moment (
t
), respectively. The relationships of
e
-log
k
are shown
in Fig. 4, where the
k
values were indicated at only normally
consolidated (NC) states and they were not calculated in the
phase “b-d”, because the strain rate was so small that the value
of
u
was nearly zero andcould not be measured with sufficient
accuracy. When
k
at 50
℃
and 10
℃
is denoted respectively as
k
50
and
k
10
,
k
50
is larger than
k
10
and the
e
-log
k
relationships for
k
50
and
k
10
are parallel to each other, as shown in the figure.This
means that the ratio of
k
50
/
k
10
is constant at the same
e
value.
It is well known that the viscosity of water is strongly
influenced by temperature. Indeed, in the testing method of
permeability defined by JIS A 1218 (2009), the measured
k
value is calculated at 15
℃
(
k
15
), taking account of the change in
the water viscosity due to temperature. The ratio of
k
50
/
k
10
is
represented by Eq. (3) with the viscosity coefficient of pure
water (
T
).
50
10
10
50
k
k
(3)
The ratio
10
/
50
is calculated to be 2.39 based on
of pure
water given in the Chronological Scientific Table (2004). As
shown in Fig. 4, the ratio of
k
50
/
k
10
for Louiseville clay is 2.44,
which is very close to the ratio
10
/
50
. Therefore, it may be
concluded that the changes in
k
and
u
with
T
are caused by
those of the water viscosity.
10
1
10
2
10
3
0.8
1
1.2
0
100
200
e
-log
p’
(10
℃
)
p'
e
log (kPa)
a
b
d
f
u
(kPa)
e
-log
p’
(50
℃
)
u
-log
p’
(50
℃
)
u
-log
p’
(10
℃
)
c
e
phase “a-b” :
phase “b-d” :
phase “d-f” :
/100
T
0
T
0
e
= 3
×
10
-6
s
-1
T
0
T
0
Figure 3. The
e
-log
p’
relationships obtained from CRS tests.


