3420
Proceedings of the 18
th
International Conference on Soil Mechanics and Geotechnical Engineering, Paris 2013
20
40
60
80
100
-0.005 0 0.005 0.01 0.015 0.02
OCR=1
OCR=2
OCR=6
Temperature (
o
C)
Volumetric Strain (%)
dilation
compression
20
40
60
80
100
-0.01
0
0.01 0.02 0.03
OCR=1
OCR=2
OCR=6
OCR=12
Temperature (
o
C)
Volumertic strain (%)
dilation
compression
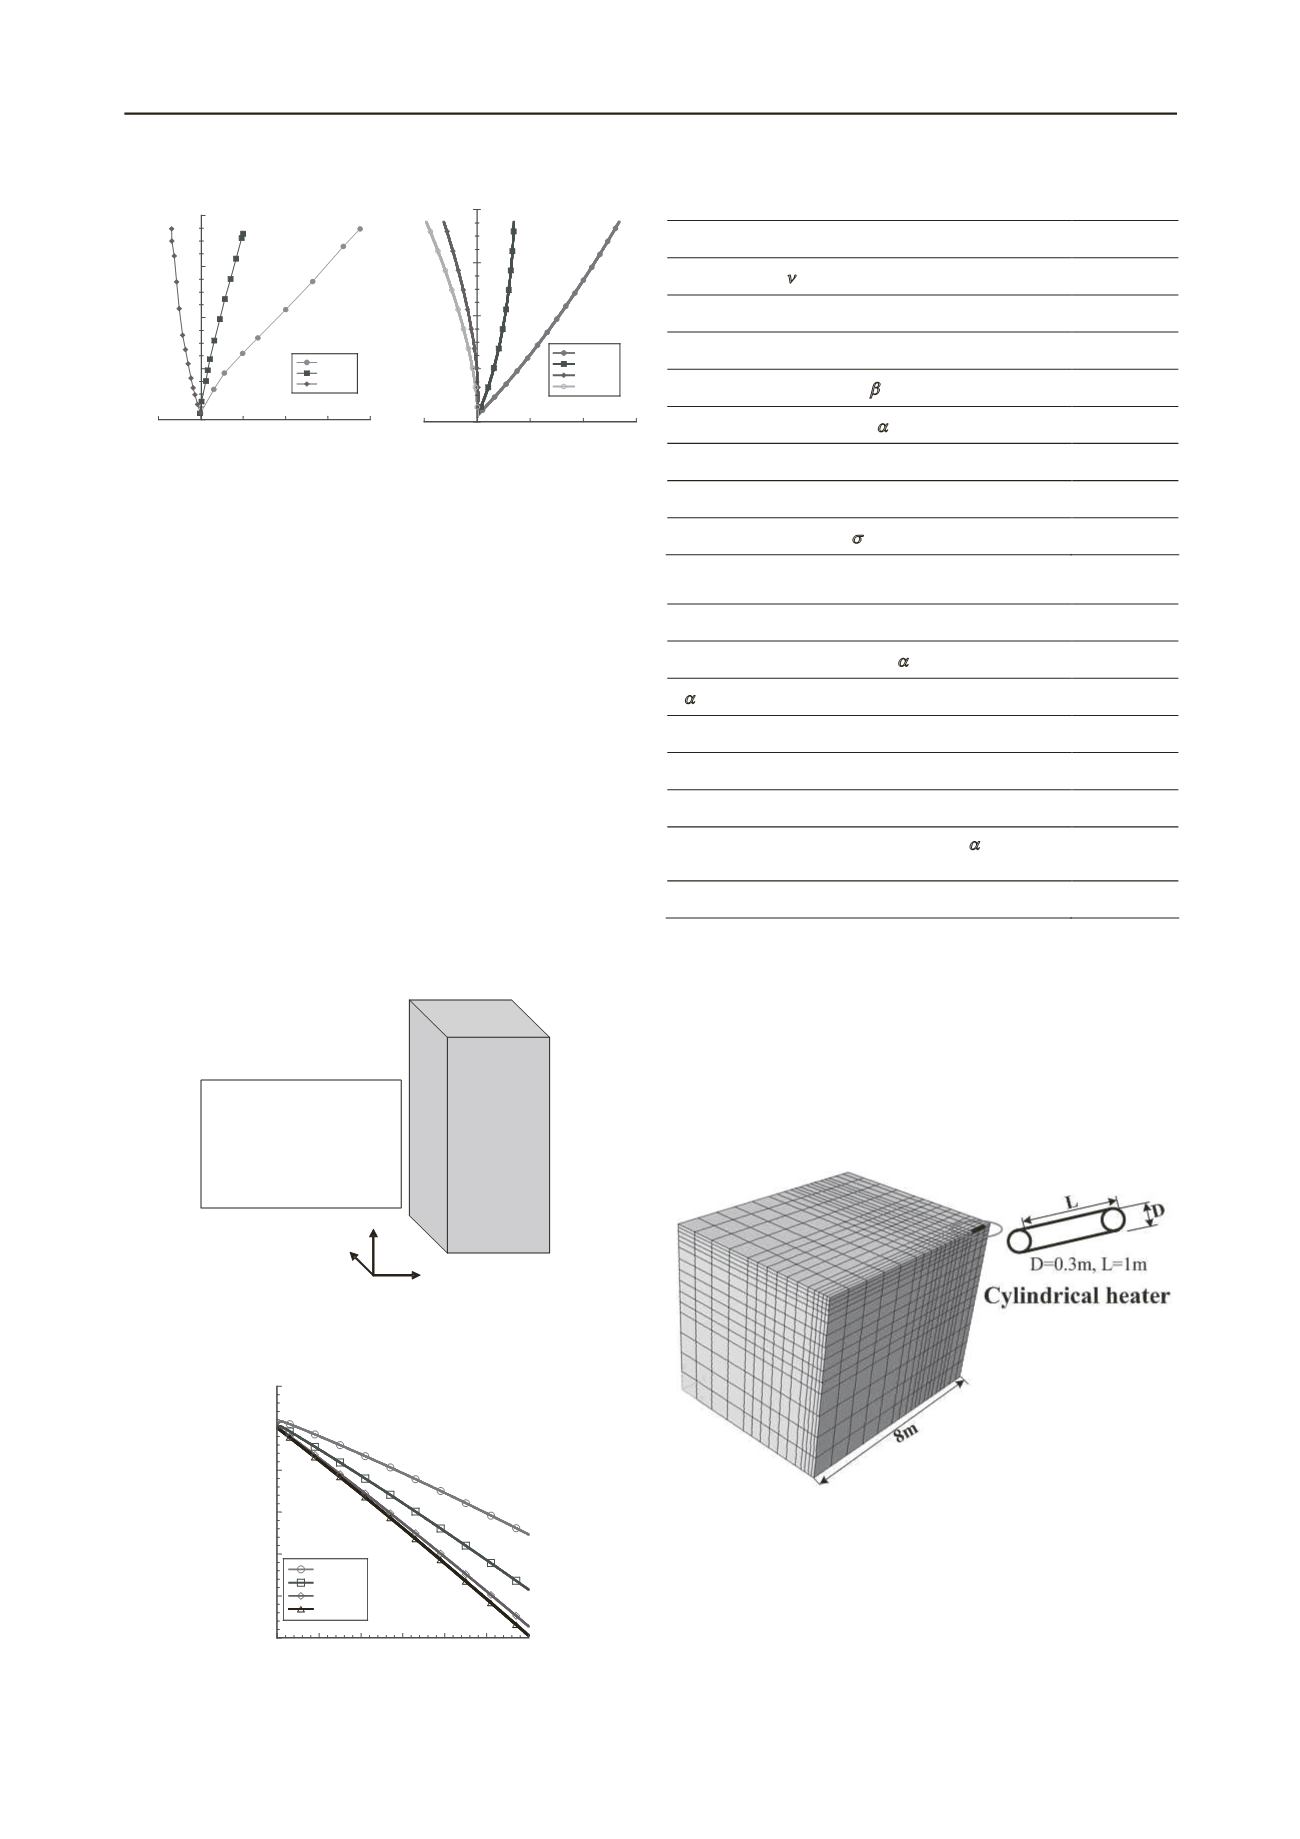
(a) Experimental result Measured
(b) Simulated result calculated
by water discharge (Baldi et al,1988) by water discharge
Figure 1. Relationship between temperature and volumetric strain
the soft rock are listed in Table 1 and Table 2.
In the test, the heat-induced volumetric strain was measured
with the amount of drained water indirectly, and its relation
with temperature for different OCR is depicted in Figure 1(b). It
is found that the thermal volume changes from contraction to
dilation as the OCR value increases, which coincides well with
the experimental results depicted in Figure 1(a). In Figure 3,
however, it is found that volumetric strain of soil is always
dilatant with the increase of temperature, no matter what OCR
may be! This phenomenon just indicates that during heating,
both water and soil particles expend but with different degree
because the thermal expansion coefficient of water is much
larger than those of soil particle, resulting in an apparent
phenomenon of water discharge, which was explained as
‘compression’. In high value of OCR, the expansion of soil
particles becomes much larger than those of water, resulting in
water absorption, which was explained as ‘expansion’ or
dilatant. In conclusion, the observed phenomenon in the
laboratory heating test is just a BVP of soil-water-heat
interaction, rather than the inherent property of the soil itself.
X
Y
Z
0
8 nodes
1 element
Displacement boundary conditions:
z=0mm plane: Z fixed
Other planes: free
Upper and lower plane: drained
Other planes: undrained
Drained boundary conditions:
Figure 2. FEM model
-0.25
-0.20
-0.15
-0.10
-0.05
0
0.05
0 0.5 1 1.5 2 2.5 3
OCR=1
OCR=2
OCR=6
OCR=12
Volumetric strain (%)
Time (days)
Figure 3. Change of volumetric strain of soil particle due to thermal
effect calculated by FEM.
Table 1. Material parameters of rock
Young's modulus
E
(MPa)
300.0
Poisson's ratio
0.35
Stress ratio at critical
R
CS
(=
1
/
3
)
10.9
Plastic stiffness
E
p
0.02
Potential shape parameter
1.5
Time dependent parameter
0.42
Time dependent parameter
C
n
0.025
Overconsolidation parameter
a
2000
Reference void ratio
e
0
(
m0
=98kPa)
0.85
Table 2. Physical properties of rock
Preconsolidation pressure (MPa)
0.6
Thermal expansion coefficient
T
(1/K)
8.0×10
-6
Water
(1/K)
2.1×10
-4
Permeability
k
(m/s)
5×10
-13
Thermal conductivity
K
t
(kJ m
-1
K
-1
Min
-1
)
0.18
Specific heat
C
(kJ Mg
-1
K
-1
)
840
Heat transfer coefficient of air boundary
c
((kJ m
-2
K
-
1
Min
-1
)
230
Specific heat of water
C
water
(kJ Mg
-1
K
-1
)
4184
3 SIMULATION OF FIELD TEST
A field test of heating process (HE-D), carried out in a soft rock
called as Opalinus clay by Mont Terri underground laboratory
(Gens et al., 2007), is also simulated with the SOFT. For
simplicity, only the case with symmetric condition is considered
in this paper. Compared to the simulation by Gens et al. (2007),
only 1/8 area is considered. Figure 4 shows 3D mesh that
consisted of 4275 cubic isoparametric elements.
Figure 4. 3D FEM mesh
In order to investigate the mechanical behavior of the rock
near HE-D experiment site, triaxial compression test under
confining pressure of 8MPa was conducted by Jia et al (2007),
whose results are first simulated by the proposed model and the
results are shown in Figure 5. By this simulation, the parameters
of the rock are determined and listed in Table 3 and Table 4. It
can be seen that the proposed model can well describe the
behavior of test rock.


