3413
Technical Committee 307 + 212 /
Comité technique 307 + 212
10
1
10
2
10
3
0.8
1
1.2
10
-11
10
-10
10
-9
10
-8
p'
e
log (kPa)
k
log (m/s)
e
-log
p’
(10
℃
)
e
-log
p’
(50
℃
)
e
-log
k
(50
℃
)
e
-log
k
(10
℃
)
k
50
/
k
10
=2.44
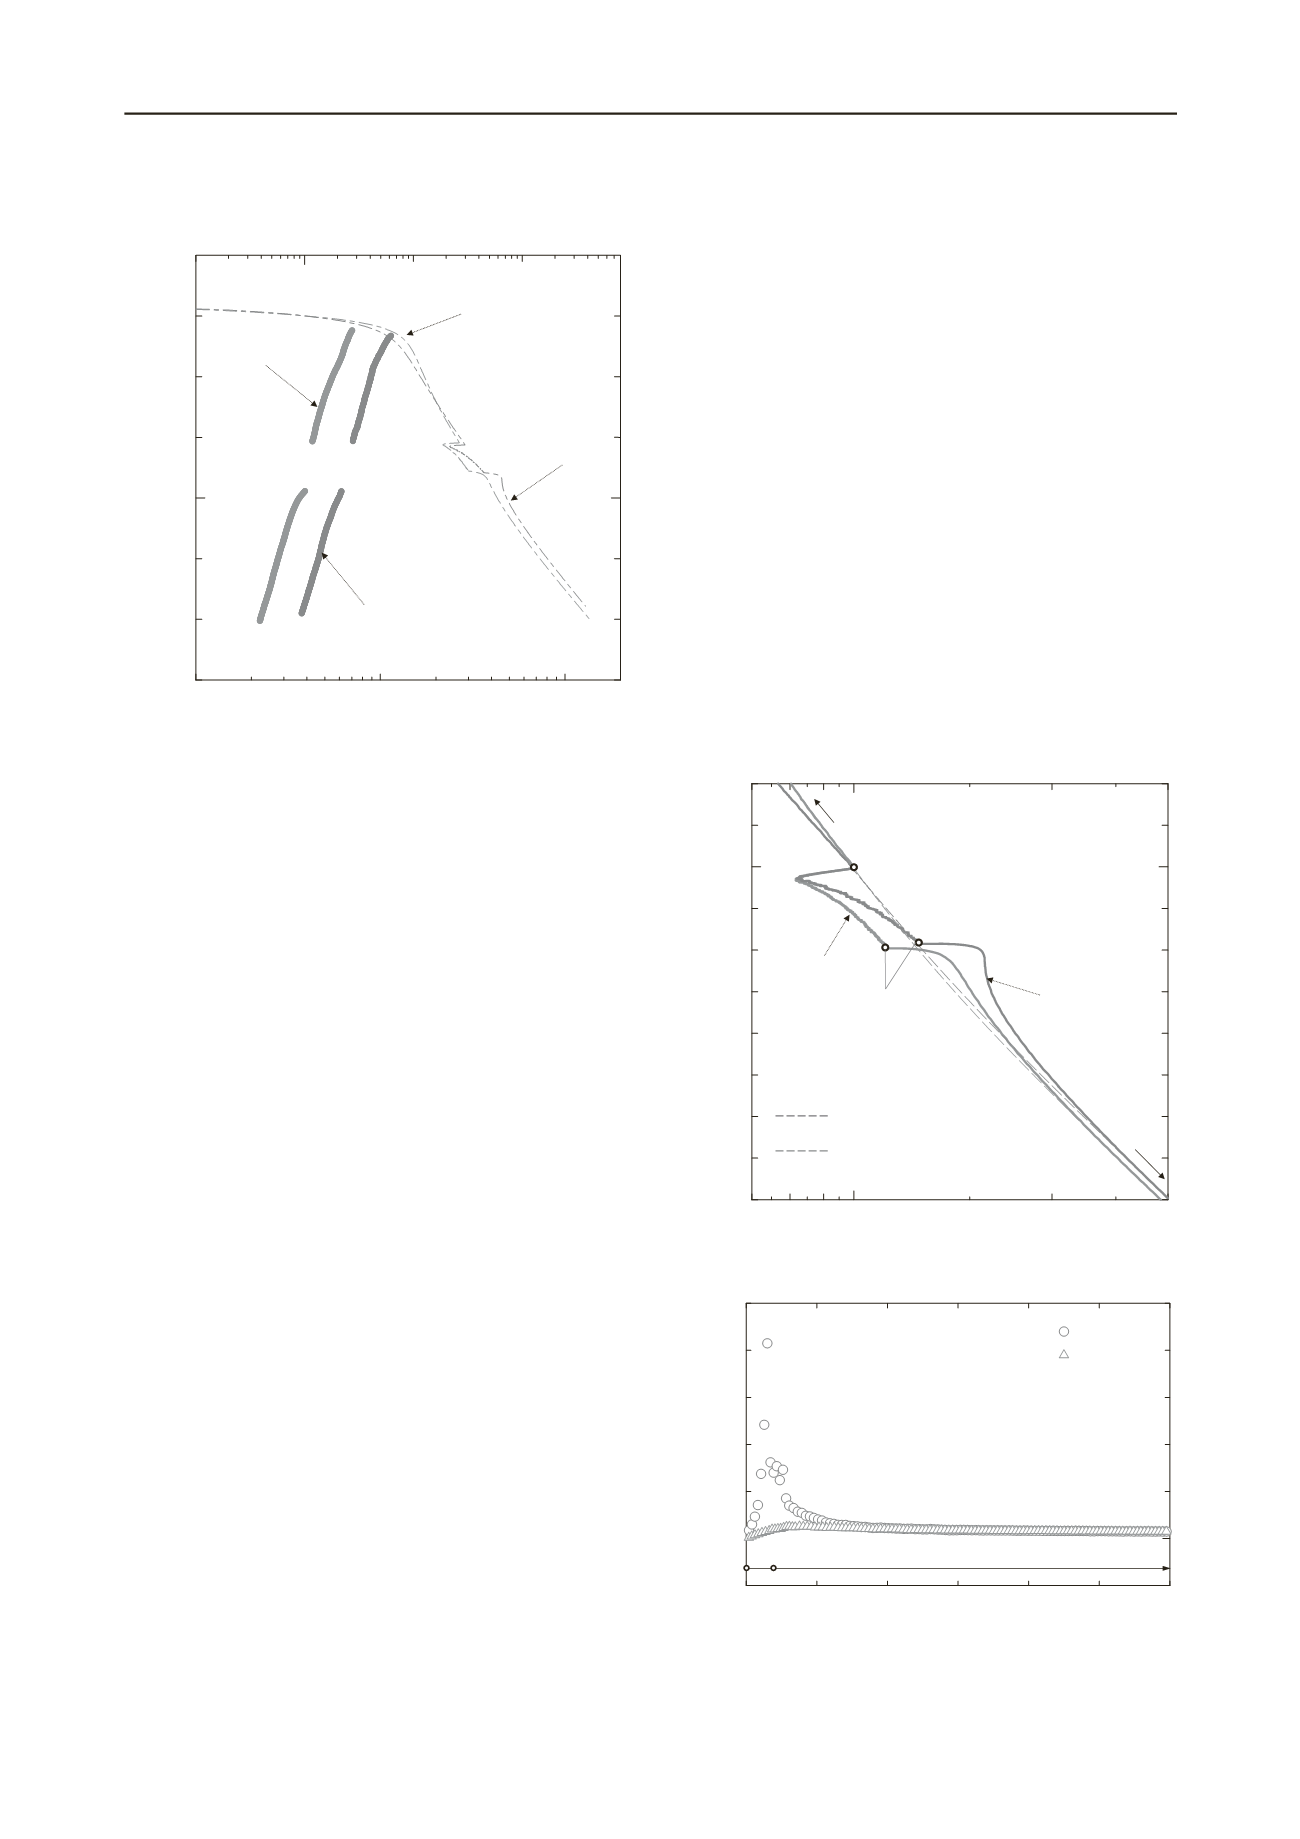
Figure 4. The variance of hydraulic conductivity with void ratio.
3.2
Combined effects of strain rate and temperature on
compressibility
The temperature effect on compressibility beforedecreasing
T
is examined by comparing the
e
-log
p’
curves in the phase of“a-
b” at 10
℃
and 50
℃
, as shown in Fig. 3. It is observed that the
e
-log
p’
relationship at high temperature shifts to the left side:
i.e.,
p’
c
decreases with an increase in
T
.In addition to the
decrease in the
p’
c
value due to high temperature, it can be
recognized that the
e
-log
p’
curve at 50
℃
crosses the curve at 10
℃
: the gradient of
e
-log
p’
relationship at the normally
consolidated state (
C
c
)under the high temperature is smaller
than that at low temperature. This behaviour is completely
different from that presented in Fig. 1.
At Pointb in Fig. 3, a strain rate was instantly decreased
during the tests.It is considered that the strain rate effectis
relevant only to the viscous component of sample
deformation.For example, in the Isotache model, the total strain
(
T
) is assumed to consist of the elastic strain (
e
) and the visco-
plastic strain (
vp
) indicated in Eq. (4):
vp
T e
(4)
To evaluatethe strain rate effect on compressibility,
e
-log
p’
relationships are rearranged as the relationships between
vp
and
p’
.It is assumed, in this study, that elastic strain is independent
of temperature, andincremental
e
is calculated using the slope
of
e
-log
p’
relationships before reaching
p’
c
as shown in Fig. 3,
where the
e
-log
p’
relationships for 10 and 50
℃
are nearly
identical.The relationships between
vp
and
p’
are shown in Fig.
5, where the
p’
is normalized by the effective stress at Point
b(
p’
1
), just before the strain rate is decreased.And the vertical
axis indicates the incremental
vp
from
vp
at Point b (
vp
).
Here, the reference equi-strain rate line (ESRL
0
vp
), which is
presented by broken lines in the figure, is defined as
vp
-log
p’
relationship that a specimen may follow if visco-plastic strain
rate (
vp
) is not changed. Tsutsumi and Tanaka (2011) assumed
that the ESRL
0
vp
can be expressed by a cubic function and the
constants in the equation were obtained by the least square
fitting.
The first interesting finding from Fig. 5 is that for both
temperatures,
p’
decreases with a decrease in the strain rate due
to the viscous effect, and this decrease in terms of the ratio
p’
/
p’
1
is not significantly influenced by
T
.After
p’
/
p’
1
attained
the minimum value,the
vp
-log (
p’
/
p’
1
)relationship seen in Fig.
5is strongly influenced by temperature.In the phase of “c-d”,
where the strain rate becomes constant at
vp
0
/100,the
vp
-log
(
p’
/
p’
1
)curve at 50
℃
approachesand crossesthe ESRL
0
vp
. In the
phase “d-e-f”, where the strain rate returned to the original
rateof
vp
0
of
, the curve considerably overshoots the ESRL
0
vp
.On
the other hand, the
vp
-log (
p’
/
p’
1
)curvein the phase of “c-d” at
10
℃
does not cross the ESRL
0
vp
and the amount of the
overshootdue to returning the original strain rate is considerably
smaller than that at 50
℃
.Figure 6 shows a changein the gradient
of
vp
-log (
p’
/
p’
1
)curve with increasing
vp
in the phase of “d-
e-f”. In the Fig. 6, thegradient of
vp
-log (
p’
/
p’
1
)curve at 50
℃
increases sharply at Point d, and then it decreases drastically
after Point b. Such a drastic change of compressibility is often
observed in the compression curves around
p’
of thestructured
cla
en
ore
rominent under the extremely small strain rate of
c
ys.
It can be considered that the specimen at high temperature
and very small strain rate has gained the ability to resist the
external deformation, as if the specimen has developed new
structure. A similar phenomenon is observed even under the
relatively fast strain rate. That is, as alreadymentioned in the
phase of“a-b”,
C
c
at 50
℃
is slightly smaller than that at 10
℃
,
although this difference is not significant. This tend cy is m
p
vp
0
/100.
0.7 0.8 0.9 1
2
3
5
0
b
d
p'
log
p'
( /
1
)
vp
(%)
a
f
c
e
ESRL
0
vp
(10
℃
)
10
℃
50
℃
ESRL
0
vp
(50
℃
)
Figure5. The relationship between incremental visco-plastic strain and
normalized effective stress.
2
4
6
8
0
200
400
The gradient of
vp
-log
p'
curve
50
℃
10
℃
vp
(%)
d e
f
of
vp
-log (
p’
/
p’
1
)curve with
increasing
vp
at the phase of “d-e-f”.
Figure 6. A change in the gradient


