3405
Technical Committee 307 + 212 /
Comité technique 307 + 212
the highly conductive stainless steel cell with the controlled
water bath was accounted for as a convection-type boundary
condition of the problem. This heat flux was assumed to be
proportional to the difference between the temperature of the
cell and the temperature of the water bath at each boundary
node, through a convection coefficient
h
. Thermal optimisation
was then aimed at identifying the values of the saturated thermal
conductivity
and the convection coefficient
h
. Calculations
were performed for different combinations of
and
h
. For each
of them, a measure of the least squares difference between
temperature simulation results and temperature experimental
measurements
was computed for different elapsed times. The
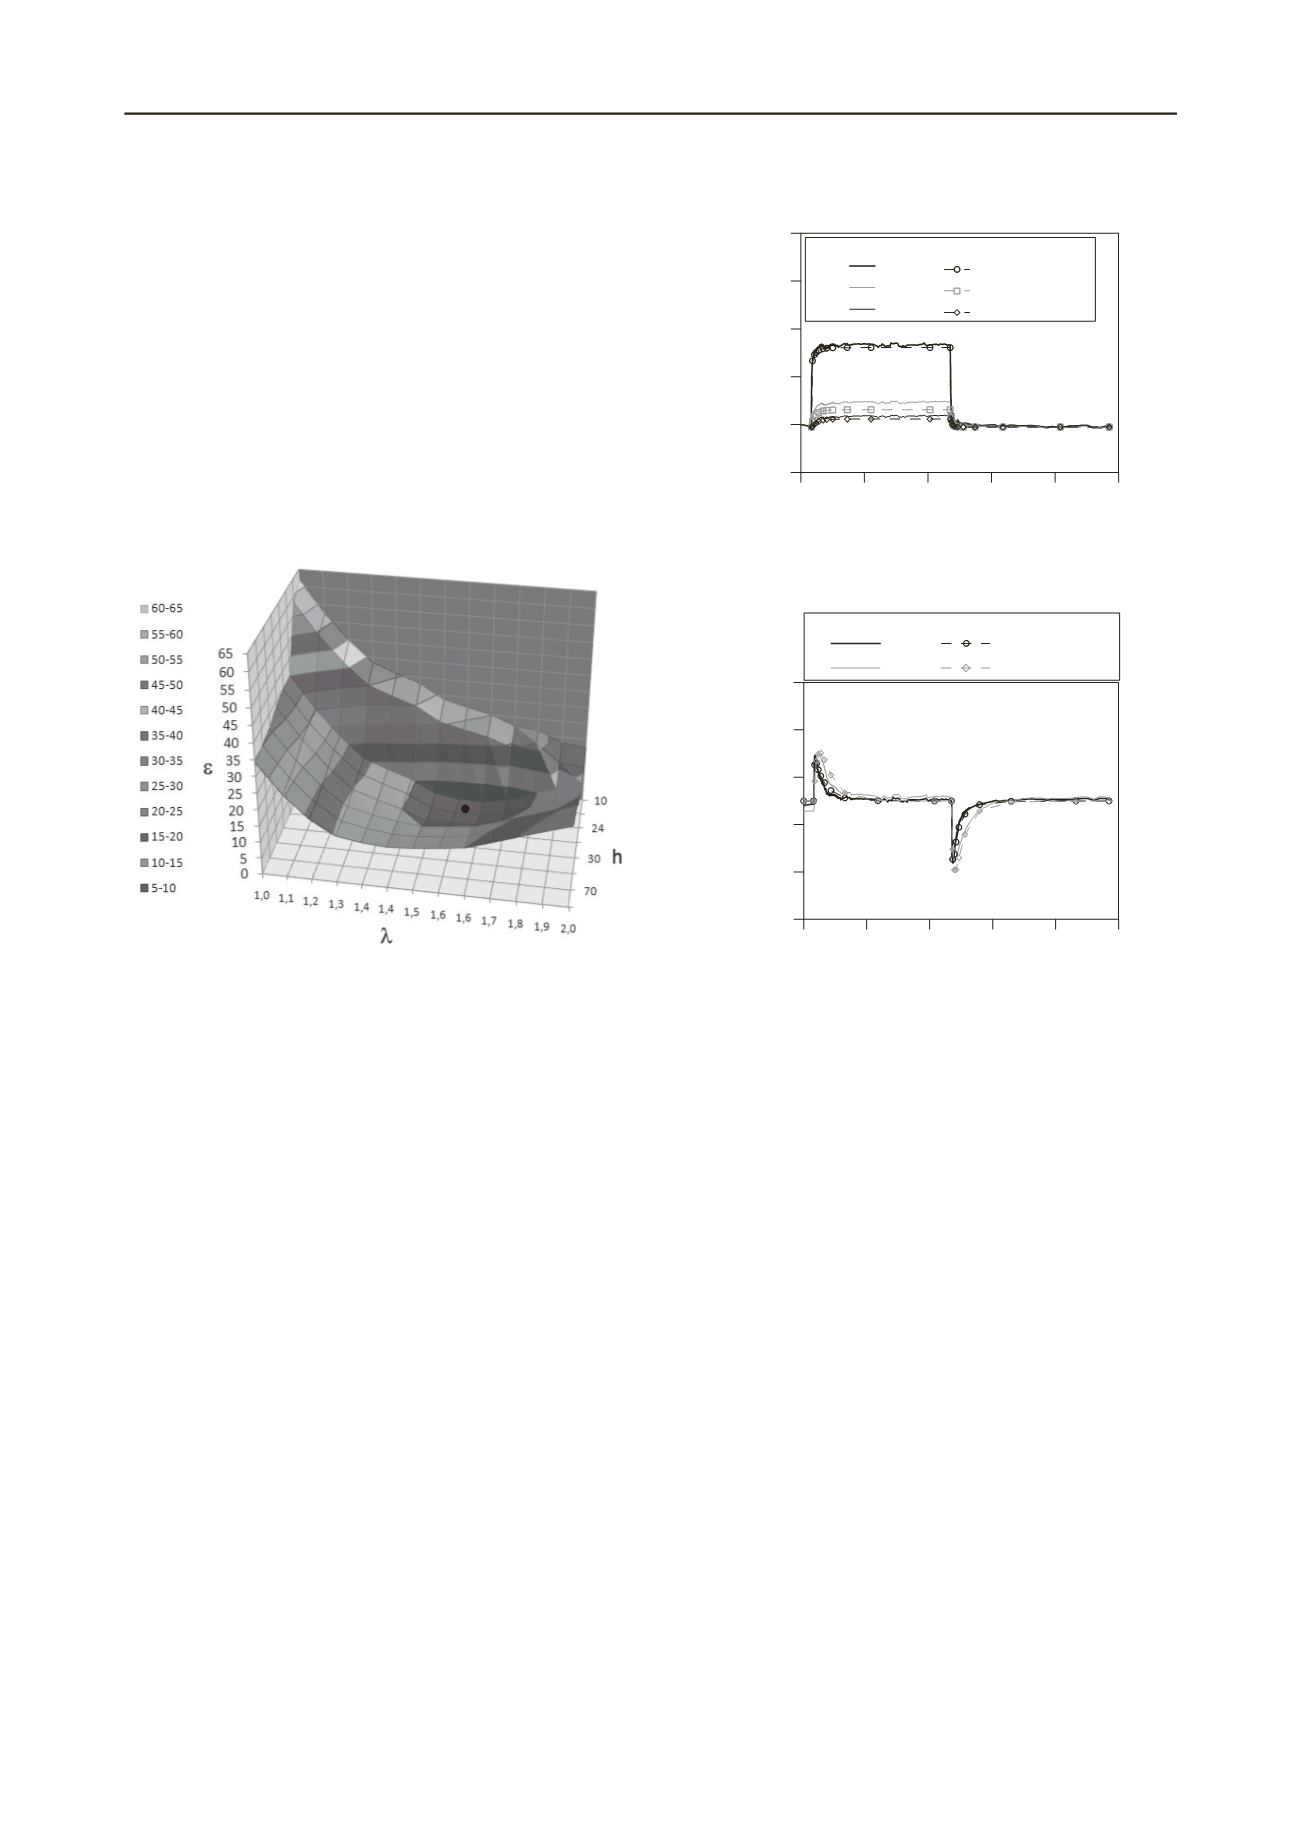
three-dimensional plot in Figure 4 shows the least squares
differences
between simulation results and experimental
observations
The best agreement was obtained for parameters
=1.6 Wm
-1
K
-1
and
h
=24 Wm
-2
K
-1
.
n of thermal conductivity
and
nvection coefficient
h
(Lima 2011).
irectly measured
parameters from independent laboratory tests.
xperime
eatures of the hydro-thermal coupling
under the test conditions.
Figure 4. Three-dimensional graph showing the differences in
temperature between observations and calculations in the back-analysis
of the heating pulse test. Determinatio
co
Back-analysed thermal parameters were used to study the
coupled thermal and hydraulic results. Water permeability and
elastic soil parameters used in the simulations, which are
reported in Table 1, were obtained from independent tests.
Controlled-gradient tests at different temperatures and constant
volume conditions for water permeability, as well as small-
strain shear moduli with resonant column and bender element
tests, have been reported by Lima (2011). Figure 5 displays the
time evolution of temperature and pore water pressure
(experimental and simulated results) during the same heating
and cooling paths presented in Figure 2. A good agreement is
observed in the pore water pressure response, which shows the
consistency between the back-calculated and d
Figure 5. Time evolution of temperature and pore water pressure:
ntal and simulated results (Lima 2011).
e
5 CONCLUSIONS
A series of heating and cooling paths were performed on Boom
Clay –a reference host formation for potential geological
disposal of ‘High-Level Radioactive Waste’ in Belgium– to
study the impact and consequences of thermal loads on this low-
permeability clay formation. Tests were performed in a fully-
instrumented heating cell –with several thermocouples and
pressure transducers– under constant volume and controlled
hydraulic boundary condition: constant water pressure at the
bottom drainage and top end with no flow condition. Selected
results of a comprehensive experimental programme on intact
borehole samples have been presented and discussed in terms of
the joint measurements of temperature and pressure changes
during the application of heating-cooling cycles.
Thermal and hydraulic results were calibrated and simulated
using coupled thermo-hydro-mechanical analyses performed
with a finite element code (CODE_BRIGHT). In particular, the
thermal conductivity of the clay was determined by back-
analysis of the thermal response. The coupled thermal and
hydraulic results were also successfully simulated using
parameters that had been back-calculated from previous heating
pulse tests and also directly from independent laboratory tests.
An overall examination of the results obtained allows the
identification of the main f
upper valve closed
backpressure 1MPa
P = 9.58 W
0 0.4 0.8 1.2 1.6 2
Time (days)
0
0.4
0.8
1.2
1.6
2
Pore water pressure (MPa)
Stage 3
Pw
1
Pw
2
Pw
1
bottom 25 mm
Pw
2
top 75 mm
Experimental results Numerical simulations
0 0.4 0.8 1.2 1.6 2
Time (day)
0
20
40
60
80
100
Temperature (ºC)
Stage 3
Experimental results
Numerical simulations
T
1
T
2
T
3
T
1
heater
T
2
bottom 25mm
T
3
top 75mm
(a)


