3421
Technical Committee 307 + 212 /
Comité technique 307 + 212
Table 3. Material parameters of rock
Young's modulus
E
(MPa)
9800.0
Poisson's ratio
0.295
Stress ratio at critical
R
CS
(=
1
/
3
)
3.0
Plastic stiffness
E
p
0.002
Potential shape parameter
1.5
Time dependent parameter
1.5
Time dependent parameter
C
n
0.005
Overconsolidation parameter
a
8000
Reference void ratio
e
0
(
m0
=98kPa)
0.159
Table 4. Physical properties of rock
Preconsolidation pressure (MPa)
900
Thermal expansion coefficient
T
(1/K)
8.0×10
-6
Water
(1/K)
2.1×10
-4
Permeability
k
(m/s)
5×10
-12
Thermal conductivity
K
t
(kJ m
-1
K
-1
Min
-1
)
0.18
Specific heat
C
(kJ Mg
-1
K
-1
)
840
Heat transfer coefficient of air boundary
c
((kJ m
-2
K
-
1
Min
-1
)
230
Specific heat of water
C
water
(kJ Mg
-1
K
-1
)
4184
5
10
15
20
-1 -0.5 0 0.5 1 1.5 2
Model
Model
Experiment
Experiment
• • • • • • • • • • • • • • • • •
• •
• •
•• • • • •
• •
• •
•• • • • •
Figure 5. Simulation of triaxial test under confining pressure of 8 MPa
for Opalinus clay
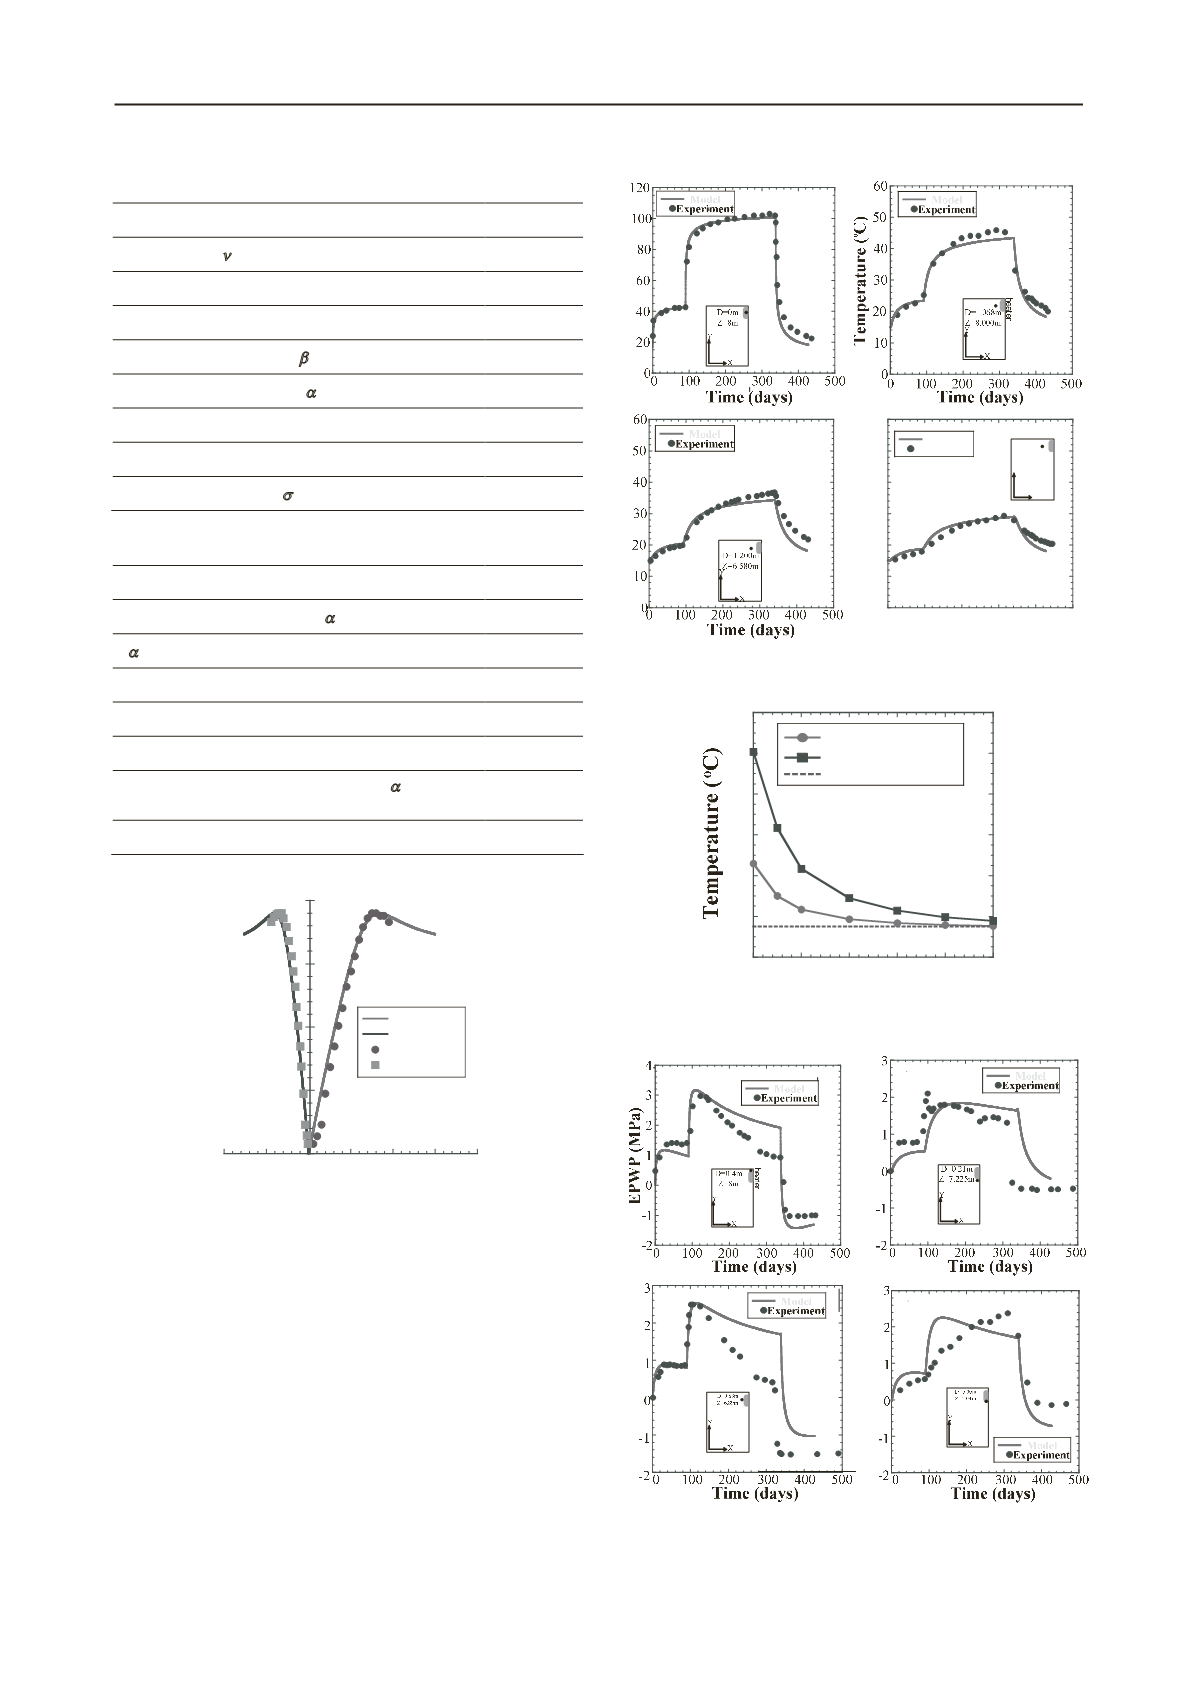
Figure 6 shows the change of temperature at the center of
heater. The temperature reached about 40° at first heating phase,
and then increased very sharply at the second heating phase up
to the highest temperature of about 100°. When the power of
heater is switched off, the temperature decreased sharply. It also
can be seen that the calculated result can well describe the
experimental data. Figure 6 also shows the change of
temperatures at different position. On the whole, the THM-FEM
analysis can well describe the HE-D experiment.
Figure 7 shows the change of temperature at different
positions. It is known from the figure that the nearer the
distance from heater is, the higher temperature will be. There is
no prominent increase of temperature at the distance 5m far
away from the heater due to the small heat conductivity of the
rock.
heater
﴿
heater
heater
X
Y
D=2.200m
Z=5.040m
0
10
20
30
40
50
60
Temperature (
o
C)
0 100 200 300 400 500
Time (days)
Figure 6. Change of temperature at different position
0
20
40
60
80
100
120
0 1 2 3 4 5
Figure 7. Computed temperature distributions at various times on cross
section
heater
heater
heater
PWP
﴾
MPa
﴿
Figure 8. Variation of EPWP at different position
The evolution of EPWP with time is depicted in Figure 8 at
the different sites. It is found that the EPWP increases sharply


